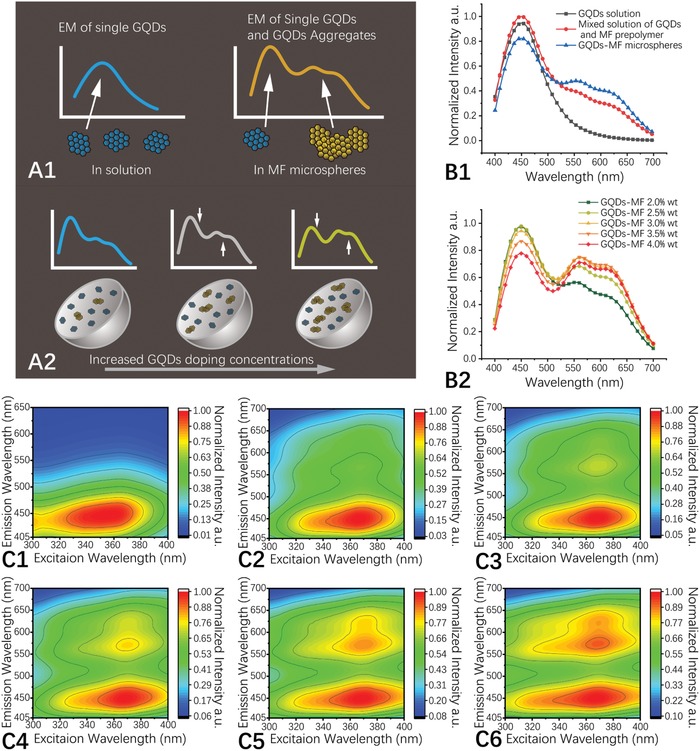
Figure 3.

Schematic illustration of A1) GQD aggregation mediated white‐light‐emitting mechanism and A2) GQD doping concentration related emission color. A) Emission spectra of GQD solution (0.1 wt%), a mixed solution of GQDs and MF prepolymer, and of the GQD‐MF microspheres, excited at 360 nm. The spectra are normalized by the mass concentration of GQDs. B) Emission spectra of GQD‐MF microspheres with different GQD doping concentrations, excited at 360 nm. The spectra are normalized by the mass concentration of the microspheres. C1–C6) 3D fluorescence spectra of GQD solution (0.1 wt%) and MF‐GQD microspheres with GQD doping concentrations of 2.0 wt%, 2.5 wt%, 3.0 wt%, 3.5 wt%, and 4.0 wt%.
