Figure 2.

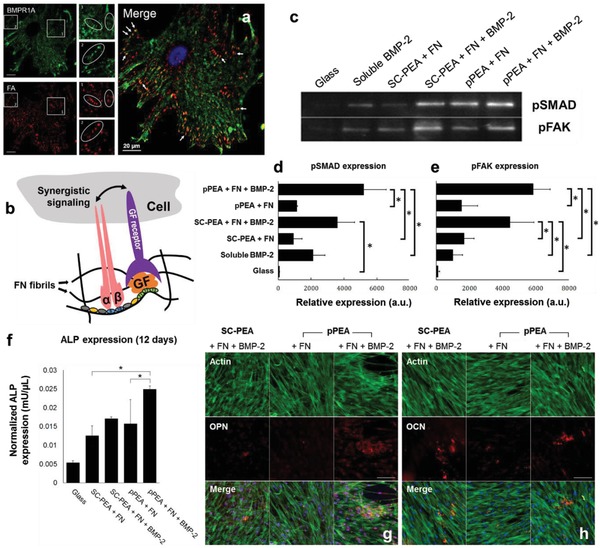
hMSC signalling and differentiation. a) Colocalization assay of BMP receptor 1A (BMPR1A, green) and FAs (red). White arrows on the merged image show areas of colocalization in yellow. Scale bar = 20 µm. b) A schematic representation showing that synergistic signalling between integrin and GF receptors can occur when the integrin‐binding (III9–10) and GF‐binding (III12–14) domains of FN are in close proximity. c) Western blotting of pSMAD 1/5/9 and pFAK, expressed by hMSCs after 1 h in culture on SC‐PEA and pPEA, with and without FN and BMP‐2. Quantified blots to show relative expressions of d) pSMAD and e) pFAK, both normalized using total protein amount, from hMSCs after 1 h in culture on SC‐PEA and pPEA, with and without FN and BMP‐2. hMSCs cultured with soluble BMP‐2 and on glass alone were used as controls. Data are presented as mean ± SD, n = 3, one‐way ANOVA with Tukey's test for multiple comparisons. *p < 0.05. f) Normalized ALP expression in hMSCs after 12 d in culture on SC‐PEA and pPEA surfaces, with and without FN and BMP‐2, from a fluorescent ALP assay. Data are presented as mean ± SD, n = 3, one‐way ANOVA with Tukey's test for multiple comparisons. *p < 0.05. Immunofluorescent labelling of g) OPN and h) OCN in hMSCs cultured on SC‐PEA and pPEA, with and without FN and BMP‐2, for 21 d. Phalloidin stains actin cytoskeleton in green and DAPI stains nuclei in blue. Scale bar = 50 µm.
