Figure 3.

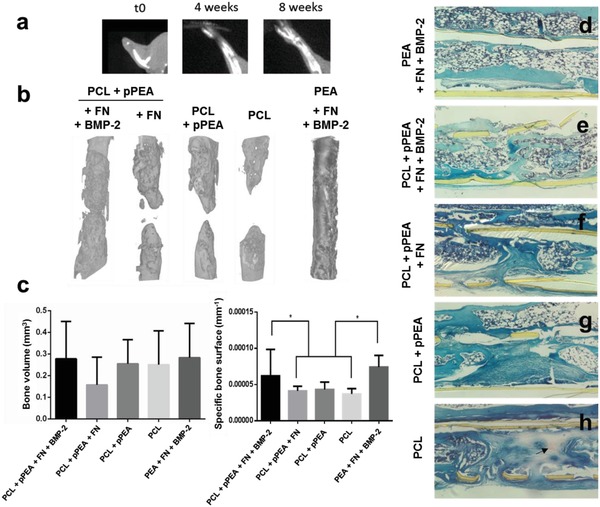
Bone regeneration in a murine model of a critical‐sized radial bone defect with low doses of BMP‐2. a) X‐ray images at 0, 4, and 8 weeks after surgery. b) 3D reconstructions from the µCT images showing the radius in the area of the defect, 8 weeks after introduction of the PCL‐pPEA implant (with or without FN and BMP‐2). c) Quantification of the volume and specific surface of new bone. Data are presented as mean ± SD, minimum n = 3. Two‐tailed t‐test was used to analyze data. *p < 0.1. d–h) Hematoxylin‐Safranin O‐fast green staining of histological sections in the area of the defect. The tissue is organized in structures resembling bone marrow (rounded white structures in panels (d) and (e)) versus fibroblast‐like morphology (extended and aligned) in the center of the defect in panels (f)–(h). Arrow points to red staining that indicates cartilage formation in panel (h).
