
Figure 3.
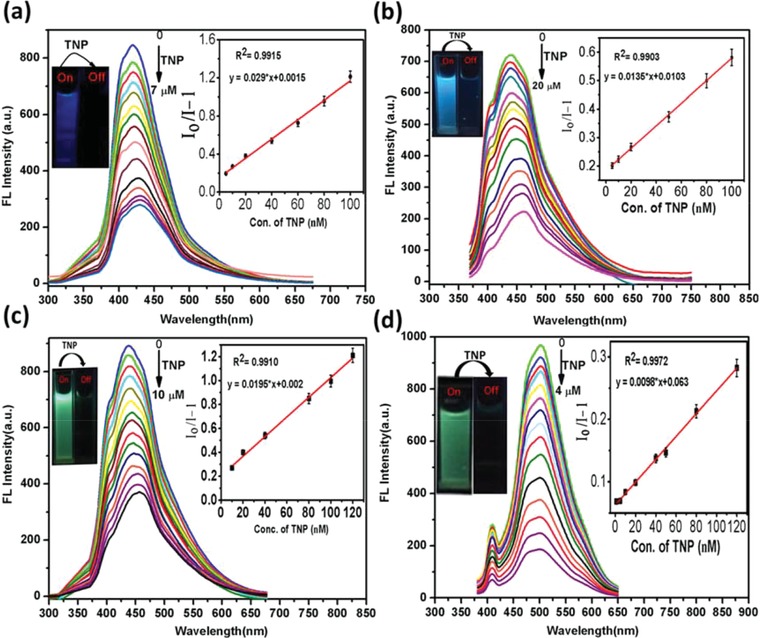
Fluorescence emission spectra of CPTQDs a), NPTQDs b), APTQDs c), TCPQDs d) in PBS buffer solution (pH 7.0) containing different concentrations of TNP (0–7, 0–20, 0–10, and 0–4 × 10⁻⁶ m, respectively). The insets (right) show the I o/I − 1 plotted against the TNP concentration (×10−9 m). The insets (left) show the color of the sensor solutions in PBS before and after adding TNP (irradiation under UV lamp at 365 nm).