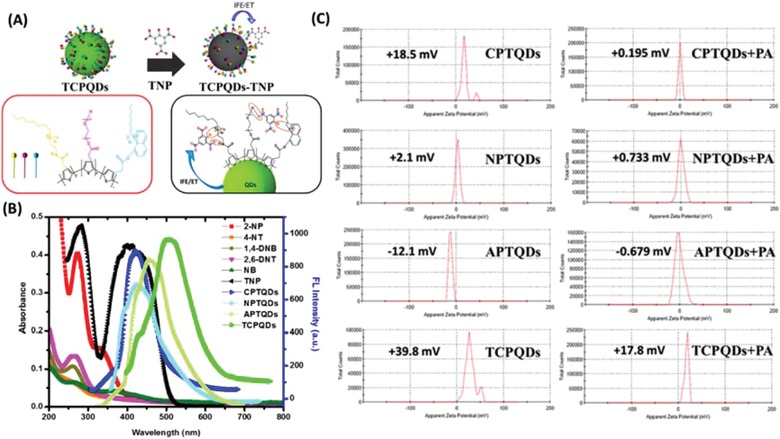
Figure 5.

A) Schematic representation of the use of the TCPQD sensor to detect TNP via IFE and a molecular interaction mechanism; B) spectral overlap between emission spectra of CPTQDs, NPTQDs, APTQDs, and TCPQDs and absorption spectra of different nitroaromatic explosives; and C) zeta potential distribution plots of the CPTQDs, NPTQDs, APTQDs and TCPQDs in the absence and presence of TNP in PBS buffer solution (pH 7.0).
