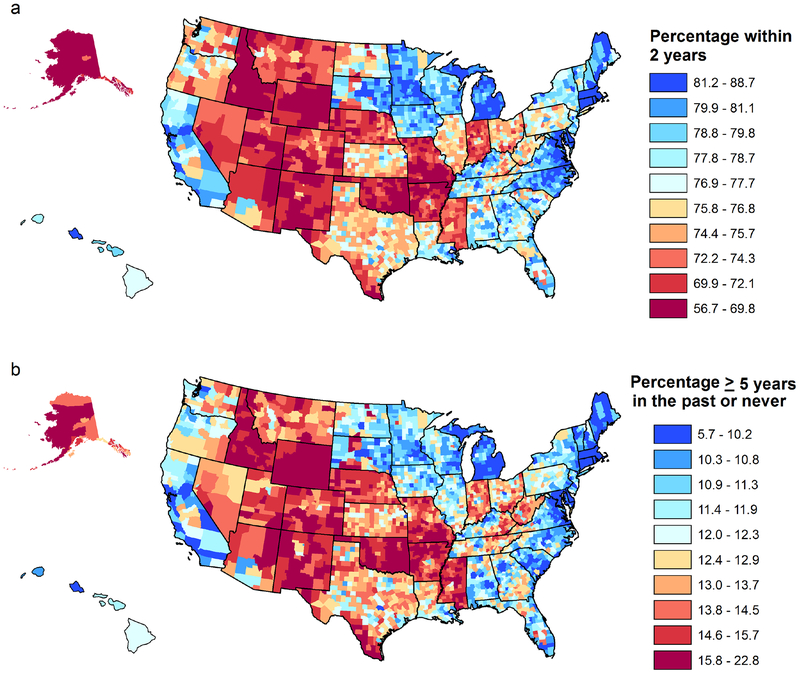
Figure 1.
Model-based County-level mean estimates (%) maps of 2 outcomes of mammography use: a. up-to-date (<2 years). b. rarely or never had a mammogram (most recent mammogram ≥5 years before the survey interview or never). The County percentage-ranges shown on the right of each map differ by map. Percentage-ranges for up-to-date mammography are in decreasing order. Percentage-ranges for rarely or never are in increasing order. County-level mean estimates were aggregated by deciles, and a different color was assigned in the legend to each decile.

