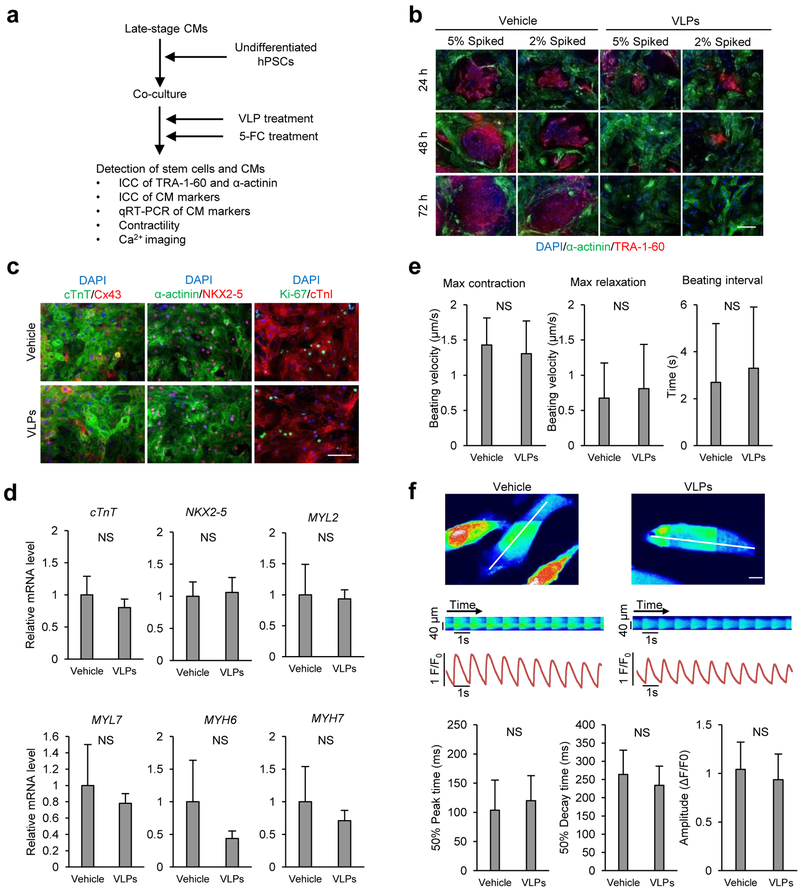
Figure 4. SSEA-5-labeled Qβ(ZZ)42@CD13 VLPs selectively kill hPSCs in co-cultures of hPSC and cardiomyocytes in the presence of 5-FC.
(a) Schematic of experimental design for the VLP treatment for co-cultures of hPSCs and cardiomyocytes. (b) Detection of hPSCs and cardiomyocytes in co-cultures. Co-cultures of hPSCs and cardiomyocytes were treated with 8 nM Qβ(ZZ)42@CD13+SSEA-521 (test) or PBS (control) for 1 h and washed to remove excess VLPs. After the treatment of both groups with 5-FC (100 μM), cells were examined by immunocytochemistry of hPSC-specific marker TRA-1–60 (red) and cardiomyocyte-associated protein α-actinin (green). Scale bars = 100 μm. (c) Detection of cardiomyocyte proteins. Cells from vehicle- and VLP-treated co-cultures were examined for the expression of cardiac transcription factor NKX2–5, gap junction protein connexin 43 (Cx43), cardiac structural proteins including cardiac troponin T (cTnT), α-actinin and cardiac troponin I (cTnI), and proliferation marker Ki-67. Scale bars = 100 μm. (d) Detection of the expression of cardiomyocyte genes by qRT-PCR. Data are presented as mean ± standard deviation of n=3 biological samples. (e) Video-based analysis of contractility. Contraction parameters are presented as mean ± standard deviation of n=6 biological samples. (f) Ca2+ transient analyses. Representative line-scan images show calcium transients in vehicle- and VLP-treated cells in co-cultures from the area indicated by the white lines. Scale bars = 5 μm. Ca2+ transient parameters are presented as mean ± standard deviation of n=22 cells. NS = no significant difference between groups (p value>0.05).

