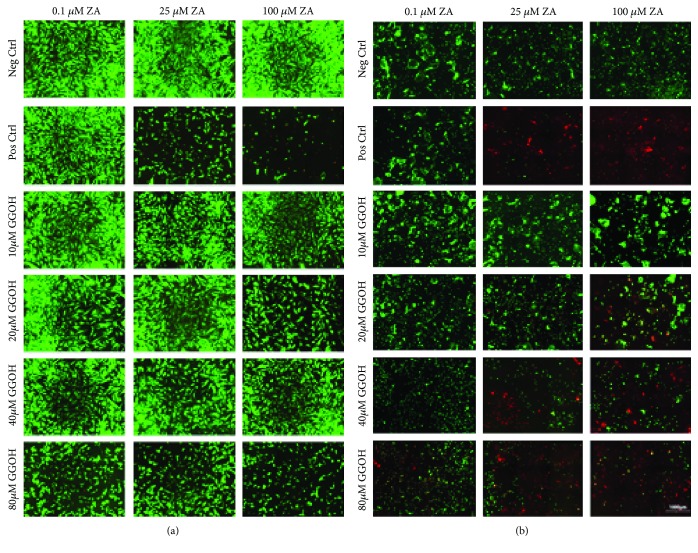
Figure 2.
Live/dead staining of bone cells (OBs and OCs). Fluorescence microscopy of live and dead cells treated at different concentrations of ZA (0.1, 25, and 100 μM) and GGOH (10, 20, 40, and 80 μM) on (a) human osteoblasts and (b) human osteoclasts after 7 days examined with fluorescence microscope. Magnification: ×10, scale bar: 1000 μm. The experiments were performed in triplicates from two different cell lots. Living cells were detected as green fluorescence and dead cells were detected as red fluorescence.

