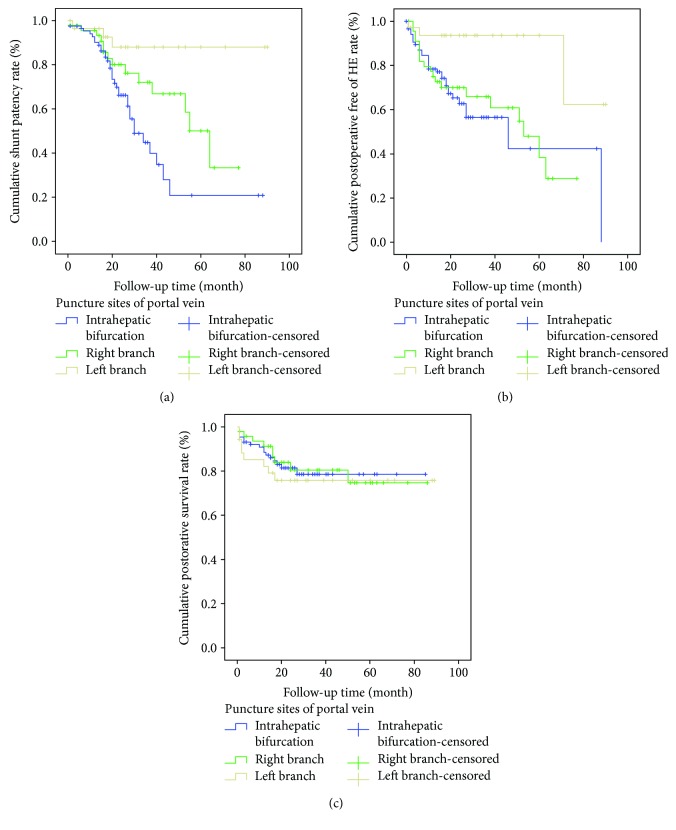
Figure 4.
Kaplan-Meier curves for shunt patency (a), postoperative HE (b), and postoperative survival (c) in the study. The rates of cumulative shunt patency and postoperative HE were significantly different among the three groups (P < 0.05), while the cumulative postoperative survival did not show any difference (P > 0.05).

