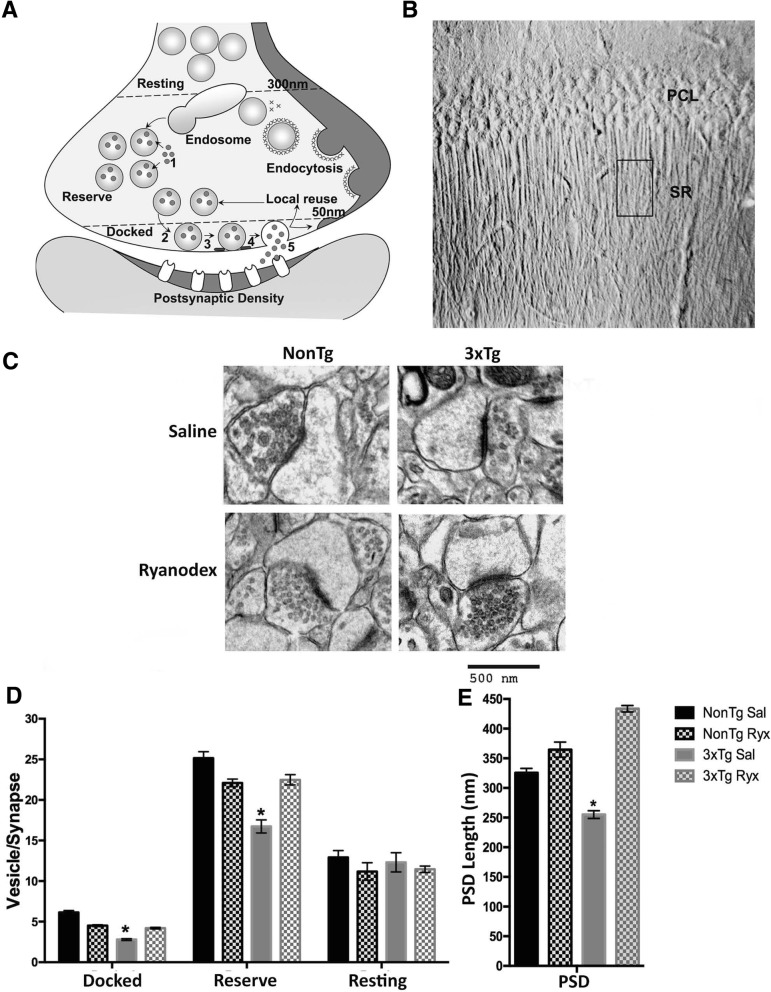
Fig. 3.
3xTg-AD mice have fewer synaptic vesicles in active zones and decreased PSD length. a Diagram showing synaptic vesicle cycle including [1] neurotransmitter uptake, [2] docking, [3] priming, [4] fusion and [5] release, and vesicle classification based on distance from the presynaptic membrane (docked: 0-50 nm, reserve: 50-300 nm, resting: > 300 nm) [41]. b DIC image showing region of interest within the CA1 stratum radiatum (SR) from which ultrathin sections were obtained for EM; PCL: Pyramidal Cell Layer. c Representative electron micrographs from saline- and Ryanodex-treated NonTg and 3xTg-AD asymmetric synapses (saline: NonTg n = 40 micrographs/5 mice; 3xTg-AD n = 56 micrographs/7 mice. Ryanodex treated: NonTg n = 36 micrographs/4 mice; 3xTg-AD n = 45 micrographs/5 mice). Scale bar: 500 nm, direct magnification: 30,000X, PSD: Postsynaptic Density. Bar graphs comparing (d) number of synaptic vesicles per synapse and (e) PSD length observed in NonTg and 3xTg-AD mice. Data are presented as Mean ± SEM; *p < 0.01 represents significantly different from NonTg Sal group

