Fig. 4.
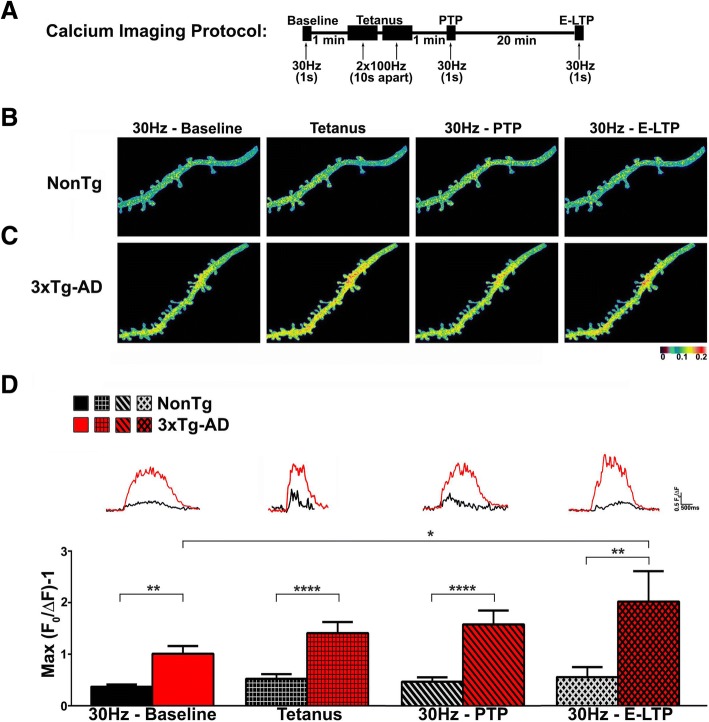
Continuously increasing synaptically-evoked Ca2+ responses in 3xTg-AD CA1 neurons during and after tetanus. a Schematic showing the synaptic stimulation and Ca2+ imaging protocol. b-c Representative pseudocolored Ca2+ images of dendritic segments from (b) NonTg and (c) 3xTg-AD neurons at baseline, tetanus, PTP and E-LTP showing increased Ca2+ responses in 3xTg-AD neurons. Colors correspond to relative Ca2+ changes indicated by the bar below. (d) Bar graphs show increased Ca2+ responses in 3xTg-AD dendrites compared to NonTg at baseline, tetanus, PTP and E-LTP (NonTg n = 10 neurons/6 mice; 3xTg-AD n = 10 neurons/6 mice). Insets: Representative traces of Ca2+ responses from NonTg (black) and 3xTg-AD (red) dendrites. Data are presented as Mean ± SEM; **p < 0.01 and ****p < 0.0001 represent significantly different from NonTg; *p < 0.05 represents significantly different from pre-tetanus baseline

