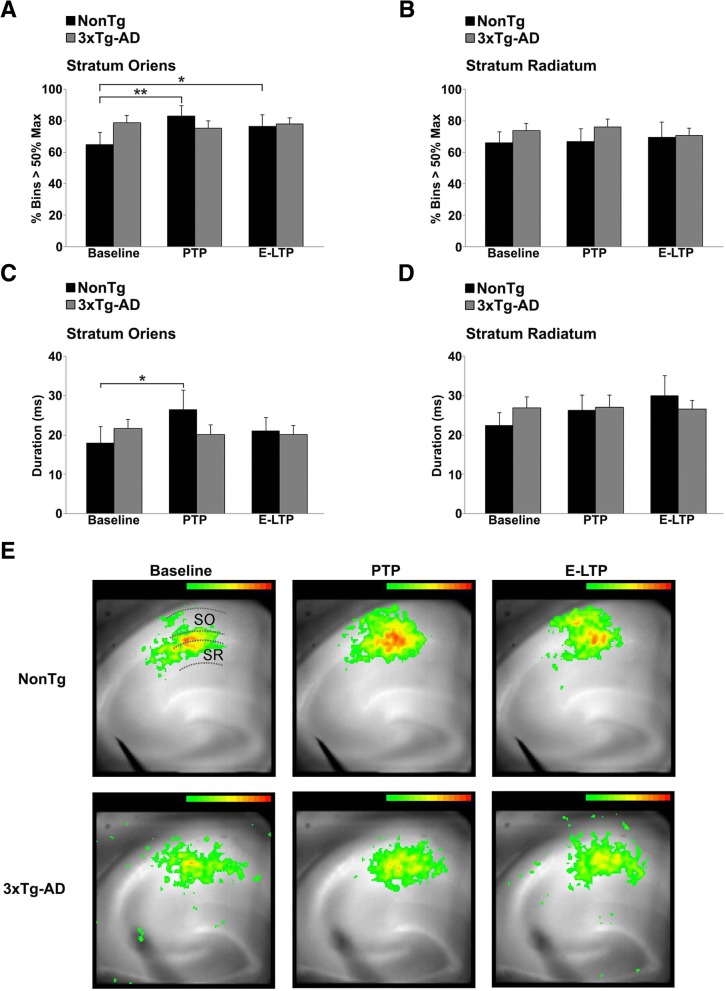
Fig. 6.
Network-level STP deficits in the CA1 SO subfield of 3xTg-AD hippocampus. Bar graphs show spread (a-b) and duration (c-d) of strong depolarizing optical signals across the CA1 subfield in response to a single pulse to CA3 at baseline, PTP and E-LTP in the SO (a, c) and SR (b, d) from NonTg (n = 9 mice, 9 slices) and 3xTg-AD mice (n = 11 mice, 11 slices). There are no changes in spread or duration of optical signals in 3xTg-AD hippocampus after tetanus, compared to increased spread and duration of optical signals in NonTg hippocampus. e Pseudocolored VSD images showing the spread of optical signals in NonTg and 3xTg-AD hippocampus during baseline, PTP and E-LTP. The SO, SP, and SR regions are indicated by dashed lines in the NonTg/Baseline image. Optical signals > 50% over baseline are shown. Data presented as Mean ± SEM; *p < 0.05 and **p < 0.01 represent significantly different from pre-tetanus baseline

