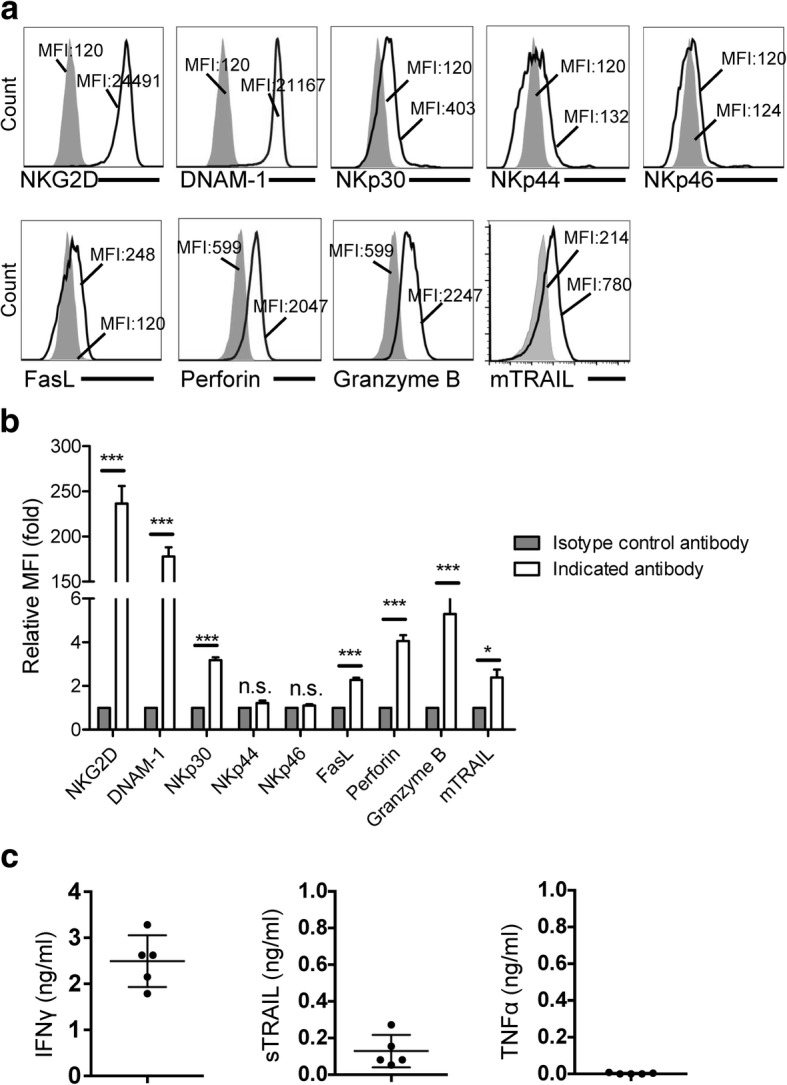
Fig. 2.

Activation molecules expressed on DNTs. a Ex vivo expanded DNTs were stained with indicated antibody (solid line) or isotype control antibody (filled histogram). b Relative MFI was calculated compared to DNTs stained with isotype control antibody. Data from 5 donors are shown. c DNT supernatants were collected, IFNγ, sTRAIL and TNFα were measured by ELISA. Each dot represents the data obtained from one healthy donor. *P < 0.05 and ***P < 0.001 compared
