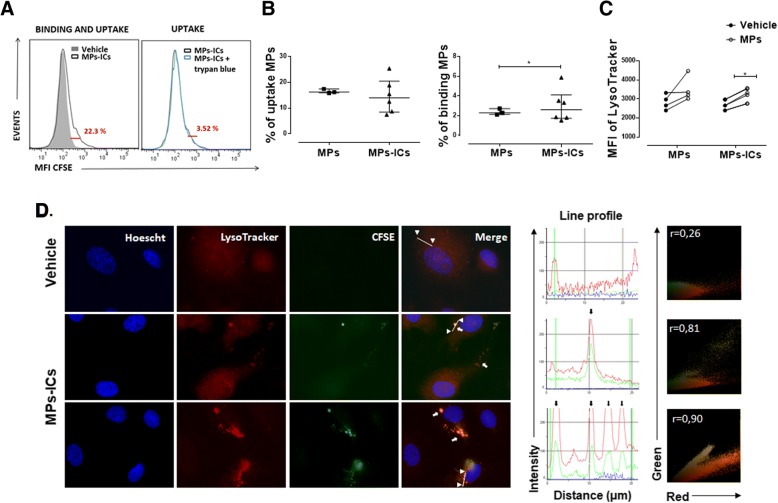
Fig. 1.
Human umbilical vein endothelial cells (HUVEC) internalize microparticles (MPs) and microparticles that form immune complexes (MPs-ICs). a Representative Overton subtraction analysis that shows the binding and uptake (left, 22.3%) of MPs-ICs previously labeled with carboxyfluorescein succinimidyl ester (CFSE) to HUVEC; filled gray, cells without MPs-ICs (vehicle); black line, cells with MPs-ICs. Right, percentage of binding and uptake of MPs-ICs (22.3%) with (blue line) and without trypan blue; the difference between these histograms shows the percentage of binding (3.52%). b Percentage of cells that take up (left) and percentage of cells that bind (right) MPs and MPs-ICs. Data are presented as the median ± interquartile range. Mann–Whitney test, *p ≤ 0.05, n = 3–6. c Mean fluorescence intensities (MFI) of LysoTracker in HUVEC without treatment (vehicle) and treated with MPs and MPs-ICs for 24 h and acquired by flow cytometry. Wilcoxon test, *p ≤ 0.05, n = 4. d Fluorescence profile (middle) and representative images (left) of the fluorescent labeling of the nucleus (blue), acid compartments (red), MPs-ICs (green), and the superposition of these images (merge) for HUVEC without treatment (vehicle) and treated with MPs-ICs from patients with rheumatoid arthritis (RA) over 1 h. White arrows indicate the presence of MPs-ICs and acid compartments, head arrows show the points from which the line was drawn (region of interest (ROI)) to determine the fluorescence profile, and black arrows indicate the peaks of colocalization between red and green. Right, Pearson correlation coefficient (r) of the same ROI is shown

