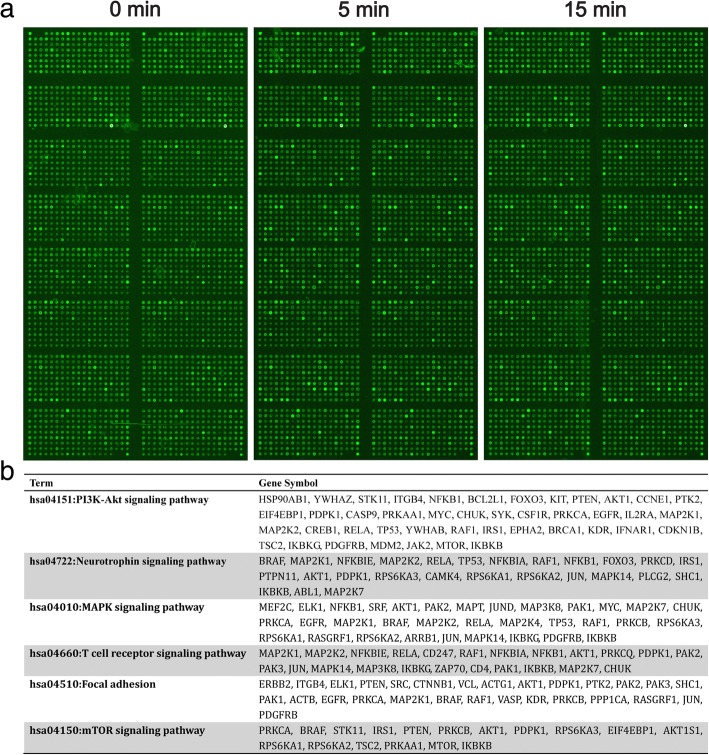
Fig. 7.
Phosphoprotein profiles in C18-4 cells after treatment of 100 ng/ml FGF5 in 5 and 15 min. a Distinct phosphoprotein profiles in C18-4 cells after 100 ng/ml FGF5 in 5- and 15-min treatment compared with the control. b KEGG informatics analysis showed the pathway enrichment of differentially phosphorylated proteins after treatment of 100 ng/ml FGF5 in 5 and 15 min compared with the control

