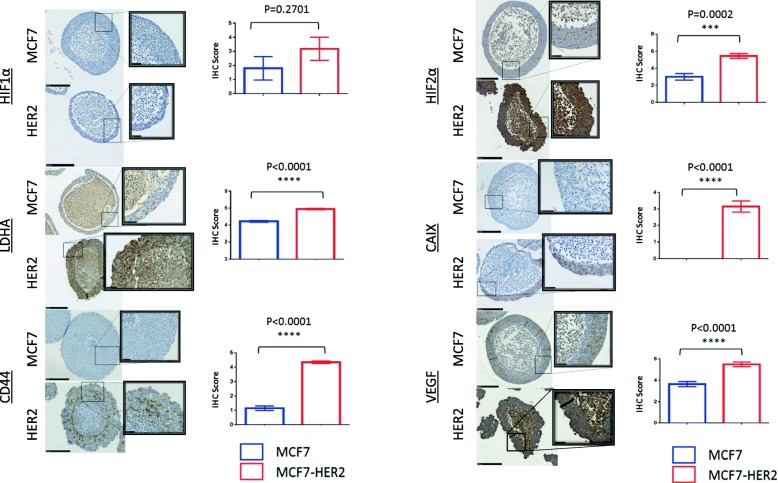
Fig. 3.
HER2 increases the levels of HIF-2α and HIF target genes in 3D spheroids. Immunohistochemistry of MCF7 and MCF7-HER2 spheroids shows the increased staining of HIF-2α, but not HIF-1α in MCF7-HER2. The increased levels of LDHA, CAIX, VEGF and CD44 were also shown. Staining was scored out of 6 for intensity and staining area. Nuclear HIF-1α spheroids were scored as a percentage of stained nuclei. Scoring for cytoplasmic or mixed staining of HIF-2α, LDHA, CAIX, CD44 and VEGF was done by first assigning a score of 0–6 for the area of staining coverage (0 = 0–10% staining, 1 = 10–25%, 2 = 25–40%, 3 = 40–55%, 4 = 55–70%, 5 = 70–85% and 6 = 85–100%) and a score of 0–3 for staining intensity, with 0 representing no visible staining, 1 being faint staining and 3 being intense staining (this was scored independently of the area covered). A final score was established by dividing the area score by 2 and adding it to the intensity score. Scoring was performed using only the viable regions of the spheroids and excluding necrotic central areas which were clearly distinguished by a loss of cellularity. Mean scoring (error bars = SEM) is shown for a minimum of seven spheroids from a representative experiment with n = 3 repeats. T tests were performed, and P values for the differences between cell lines are shown. (Scale bars = 250 μm (inset image scale bars = 50 μm)

