Fig. 1.
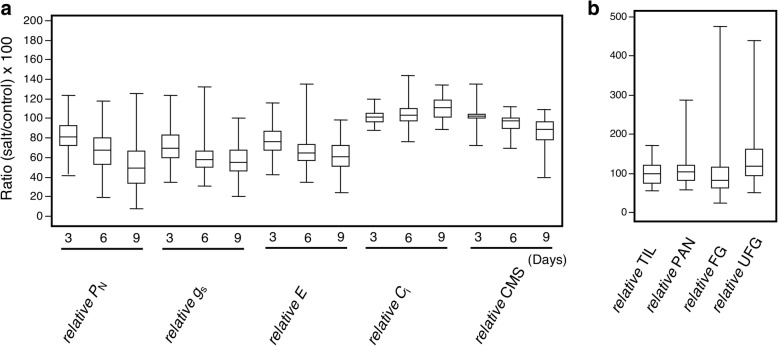
Box plots for relative phenotypic values (a) and yield-related traits (b) (calculated as percent phenotypic value in salt divided by control condition). The median of each trait is shown as a horizontal bar in the box, and the upper and lower sides of a box represent the first and third quartile values of the distribution, respectively. Whiskers represented maximum/minimum values. PN: net photosynthetic rate; gs: Stomatal conductance; E: Transpiration rate; Ci: intercellular CO2 concentration; CMS: Cell membrane stability, TIL: number of tillers per plant; PAN: number of panicles per plant; FG: number of filled grains per plant and UFG: number of unfilled grains per plant

