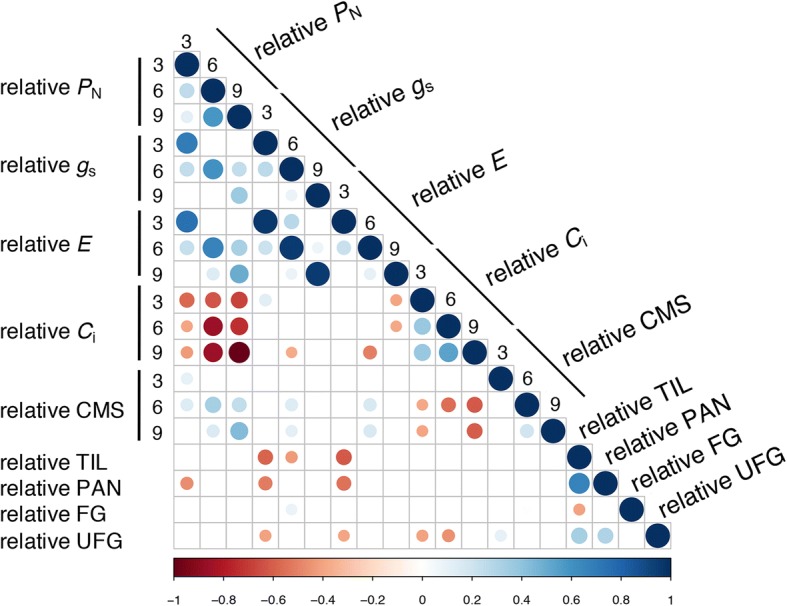
Fig. 2.

Pearson correlation coefficients computed for susceptibility indices of all traits and timings. PN: net photosynthetic rate; gs: stomatal conductance; E: transpiration rate; Ci: intercellular CO2 concentration; CMS: cell membrane stability, TIL: numbers of tillers per plant; PAN: number of panicles per plant; FG: number of filled grains per plant and UFG: number of unfilled grains per plant. Cells with correlation values not significant at p-value < 0.05 are left blank
