
Fig. 4.
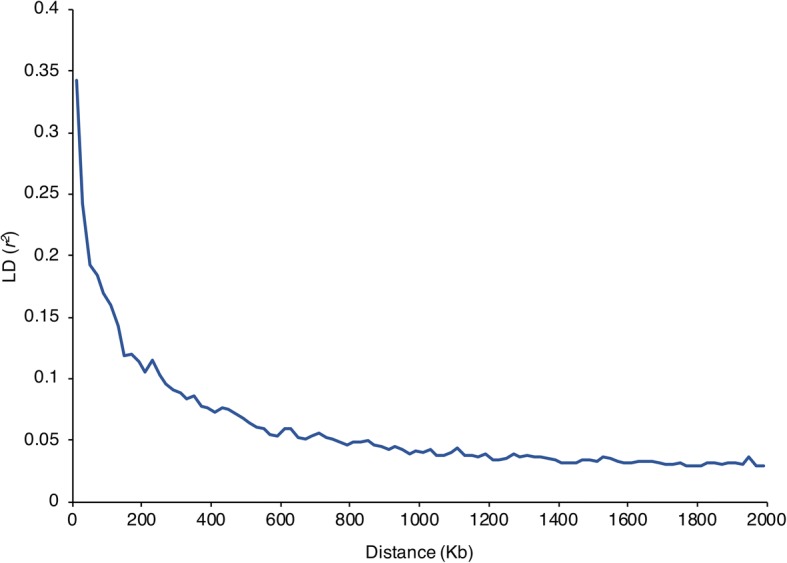
LD pattern and LD decay in the whole panel. The whole genome r2 values from PLINK were first sorted by r2 values, and then divided into 100 blocks of 20 kb. The r2 values in each block were averaged and plotted against the physical distance
Official websites use .gov
A
.gov website belongs to an official
government organization in the United States.
Secure .gov websites use HTTPS
A lock (
) or https:// means you've safely
connected to the .gov website. Share sensitive
information only on official, secure websites.
LD pattern and LD decay in the whole panel. The whole genome r2 values from PLINK were first sorted by r2 values, and then divided into 100 blocks of 20 kb. The r2 values in each block were averaged and plotted against the physical distance