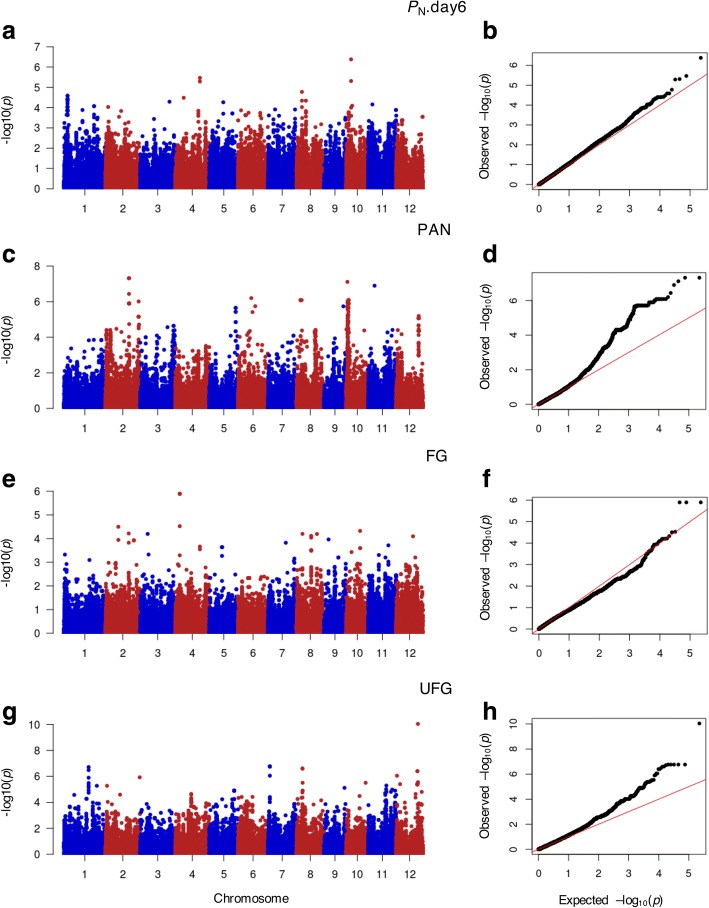
Fig. 5.
Manhattan and Quantile-quantile (Q-Q) plots of GWAS. GWAS analysis was carried out using SNP markers from the exon region associated with (a and b) PN on day 6 after the salt stress treatment: PN.day6 (c and d) PAN (e and f) FG (g and h) UFG of 104 accessions as phenotypic data. For Manhattan plots, x-axis represents SNP positions across the entire rice genome by chromosome and the y-axis is the negative logarithm p-value: -log10 (p) of each SNP. For Q-Q plots, x-axis represents expected -log10 (p) and y-axis is observed -log10 (p) of each SNPs. PN: net photosynthetic rate; gs: stomatal conductance; E: transpiration rate; Ci: intercellular CO2 concentration; CMS: cell membrane stability, TIL: number of tillers per plant; PAN: number of panicles per plant; FG: number of filled grains per plant and UFG: number of unfilled grains per plant

