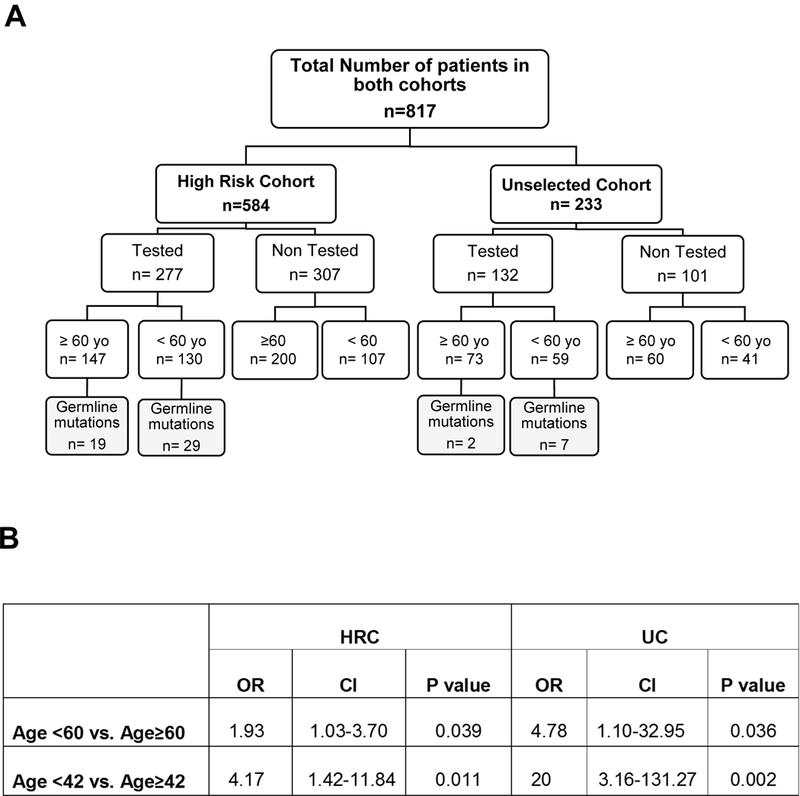
Figure 1. A. Flow Diagram.

Mutation status by age of diagnosis in both cohorts (HRC and GC); B. Statistical analysis assessing the association between mutation status and age (age ≥ 60 years vs < 60 years and age ≥ 42 years vs < 42 years) in HRC and GC. OR: Odds Ratio; CI: Confidence Interval.
