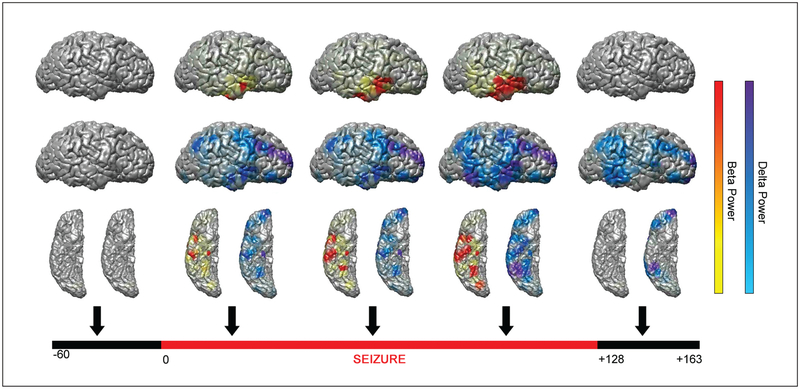
Figure 4.
Time course of single frames from a three-dimensional color movie showing beta frequency (13–25 Hz, warm colors) and delta frequency (0.5–4 Hz, cool colors) power during a seizure arising from the right temporal lobe. Arrows indicate time samples for single frames from a video representing a moving 10 s window at 1 s increments. Signal power changes are normalized relative to 60 s baseline. Lateral (top two rows) and inferior (bottom row) views are shown for the right hemisphere at each time point. For video of the full time course see Supplementary Video 1 online. Reproduced using data originally published in Englot and others (2010), by permission of Oxford University Press

