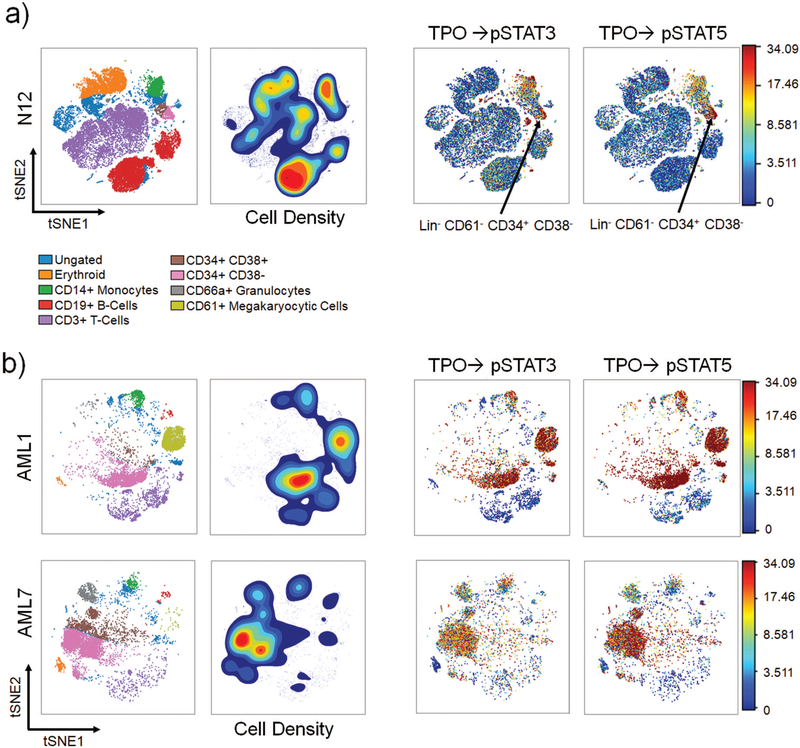
Figure 2.
viSNE analysis reveal aberrantly delocalized and heterogeneous TPO response in sAML a) Far Left: Healthy viSNE map with labeled populations. Left: Density contour viSNE map where red represents the greatest density and blue represents the least. Right: viSNE map showing response to TPO colored by phospho-marker intensity where red represents the strongest signal and blue represents the least. The arrow marks the HSPC compartment in healthy bone marrow; b) Far Left: sAML viSNE map with labeled populations. Left: Density contour viSNE map where red represents the greatest density and blue represents the least. Right: viSNE map showing response to TPO colored by phospho-marker intensity

