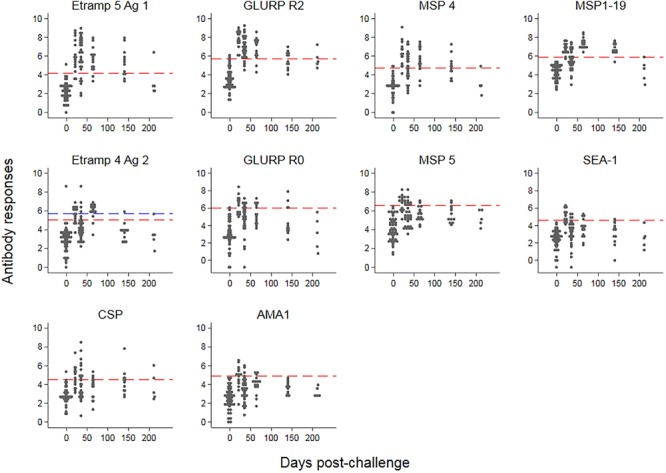
FIGURE 2.

Kinetics of antimalarial antibody responses after controlled human malaria infection. Antibody responses (expressed as log-transformed median fluorescence intensity corrected for background reactivity) are shown over time, starting 1 day pre-challenge. Red dashed lines represent thresholds of seropositivity using the mean plus two standard deviations of pre-challenge responses across 45 participants. For Etramp 4 Ag 2, the outlier at baseline (blue triangle) was removed for the threshold calculation; the blue dashed line represents the threshold if the outlier at baseline was included.
