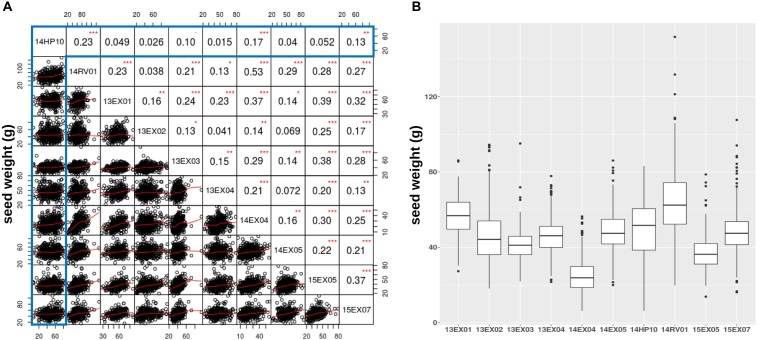
FIGURE 4.
Comparison of seed weights per plant measured on the Heliaphen phenotyping platform and in field conditions. (A) Correlation matrix between the seed dry weights of the SUNRISE hybrid panel (n = 426) grown on the platform (14HP10, highlighted in the gray box) and the nine field trials (14RV01, 13EX01–04, 14EX04–05, 15EX05, and 15EX07). The correlation coefficients are indicated in the upper right section of the panel, with significant differences indicated by asterisks (∗p < 0.05; ∗∗p < 0.01; ∗∗∗p < 0.001). (B) Boxplot of the seed dry weights observed for the SUNRISE panel.

