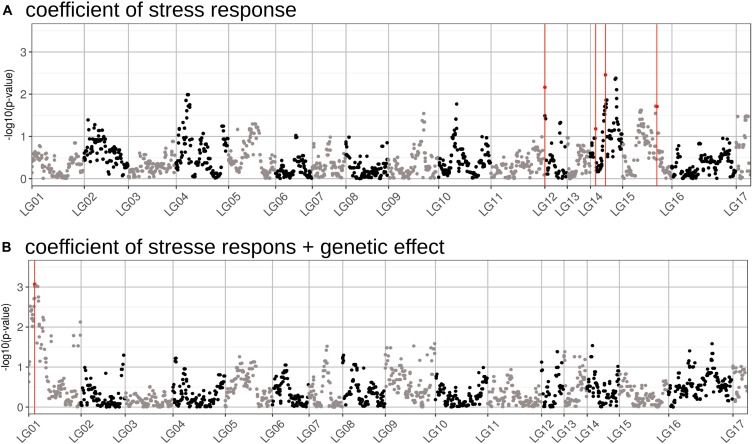
FIGURE 5.
Manhattan plots of the GWAS performed for two traits related to drought stress tolerance. (A) Results of the GWAS performed on the genetic coefficient of stress response. (B) Results of the GWAS performed on the sum of the coefficients for the stress response and the genotypic effect (total genetic effect). The markers found to be associated with each effect using the MLMM method are highlighted in red. The p-values on the graph correspond to those obtained using a classical GWAS model, performed during the first step of the MLMM method.

