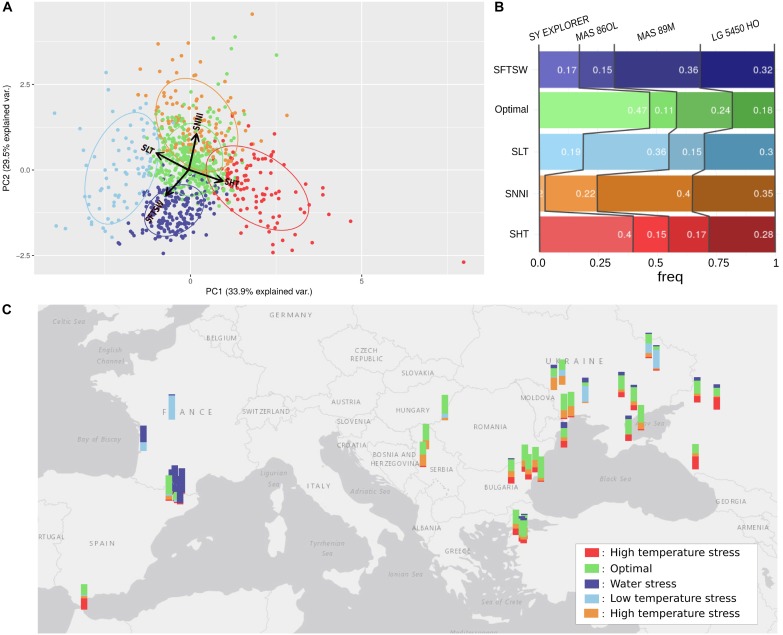
FIGURE 8.
Use of simulation modeling to characterize the stresses in 42 European sunflower cropping environments. (A) Clustering of environments (year-location) by the principal components of average simulated stresses for four sunflower genotypes. The PCA was performed using parameters for high temperature stress (SHT), low temperature stress (SLT), water stress (SFTSW), and nitrogen deficit (SNNI). Variables are represented with red arrows. The environments are clustered into five groups; four are associated with a specific stress and named accordingly, and the one without any obvious stress influence was named “Optimal.” (B) Standardized yields of each genotype ranked for each simulated environment group, with the frequency of the highest ranked genotype for each environment cluster reported inside the bars. (C) Map of Europe with a barplot at each location. The colors of the barplots indicate the occurrence of the location in the different environment clusters.

