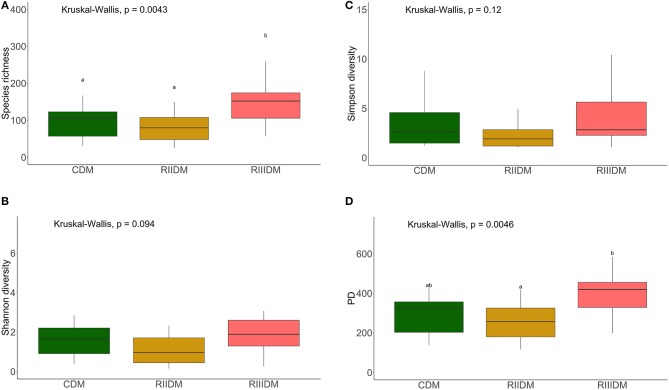
Figure 3.
Diversity of the bacterial communities of the intestinal mucus. Boxplots show the species richness (A), Shannon index (B), Simpson index, (C) and Faith's phylogenetic diversity (D). Different letters indicate statistically significant differences (P < 0.05) between the study groups. The feed group codes are as follows: Control, CDM; RII, RIIDM; RIII, RIIIDM.

