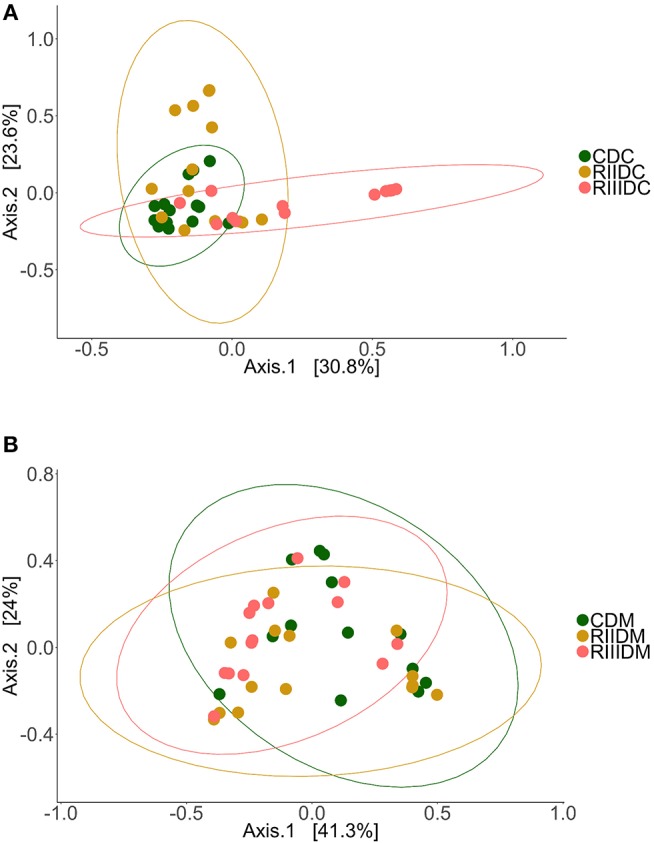
Figure 4.

Beta diversity of the intestinal bacterial communities. Principal coordinate analysis plot (A) shows the differences in the composition of the bacterial communities in the intestinal content (Control, CDC; RII, RIIDC; RIII, RIIIDC). Principal coordinate analysis plot (B) shows the differences in the composition of the bacterial communities in the intestinal mucus (Control, CDM; RII, RIIDM; RIII, RIIIDM).
