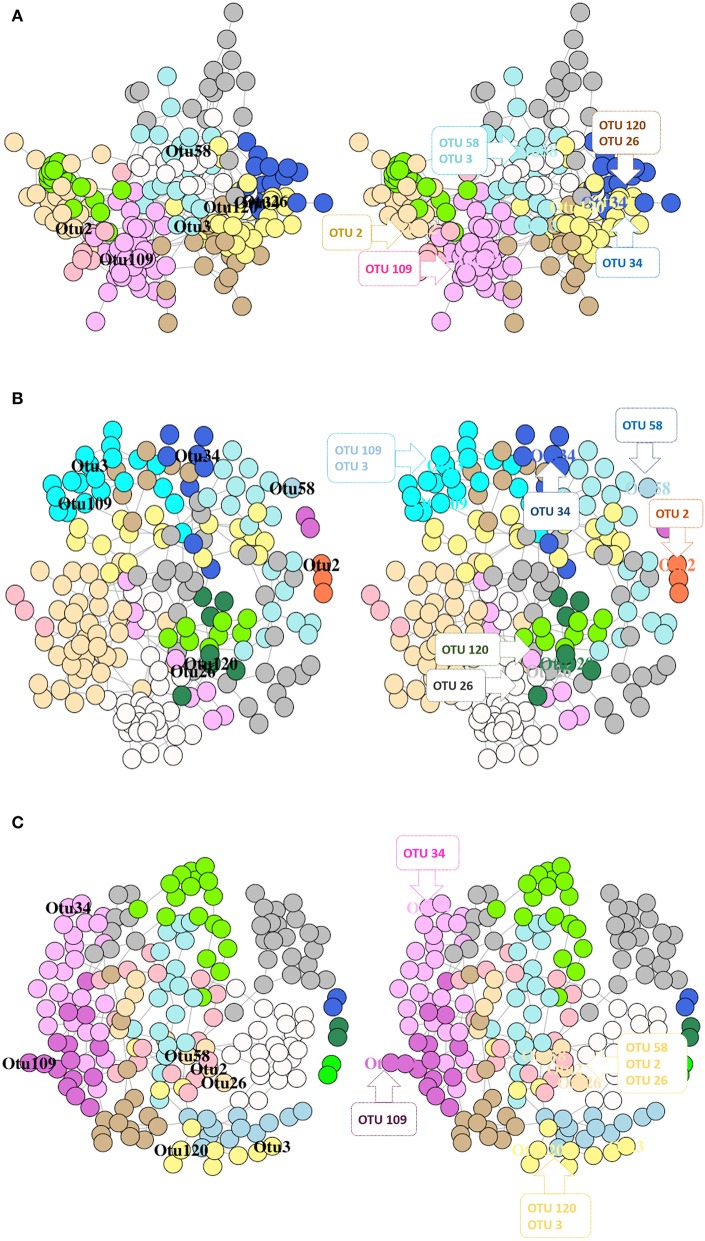
Figure 9.
Network graphs showing the significantly abundant and relevant OTUs of DI mucus in different modules based on their membership for control fish (A), RII (B), and RIII fish (C). Nodes represent OTUs and specific colors of the modules reveal the membership of the significantly abundant and relevant OTUs. The left graph shows the location of the OTUs and in the right graph the significantly abundant and relevant OTUs that belong to the same module are shown in callouts.

