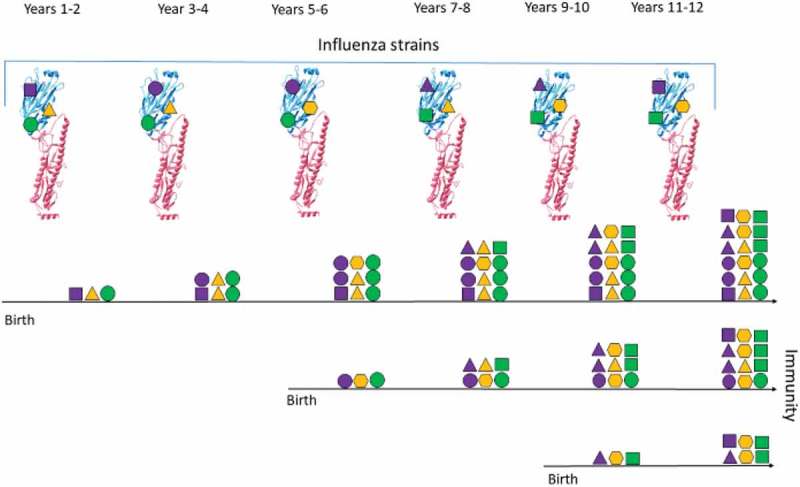
Figure 1.

Illustration of Influenza Immunity Over Time.
The diagram shows how the immunity of three individuals changes (horizontal black lines) over a period of years. Three epitopes are represented on the haemagglutinin (HA) structure (protein structures overlaid with purple, yellow and green shapes), which vary through time (different shapes). After an encounter with a specific strain, individuals acquire immunity to the encountered epitopes, which is represented by the presence of different shapes for each individual. Immunity is commutative through time and can increased by multiple encounters (stacked shapes). Similar epitopes are encountered periodically. This leads to a different immunity profile of individuals based on their year of birth.
