
Figure 1.
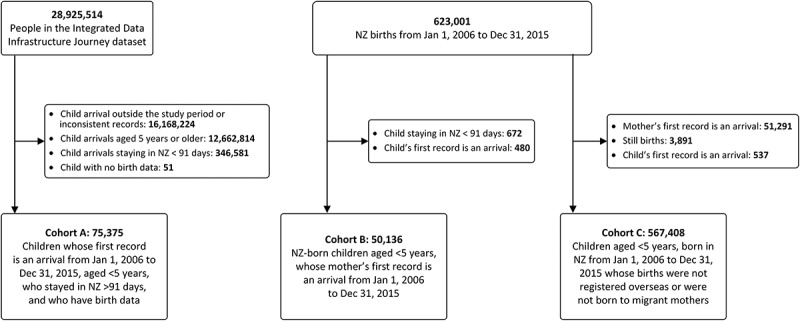
Participant flow chart of children for Cohorts A, B and C and exclusions (some children were counted in multiple exclusion categories). Note it is the policy of Statistics New Zealand that counts are randomly rounded to a number divisible by 3 in order to protect privacy; thus, the numbers of inclusions and exclusions will not reconcile precisely.