Figure 3.
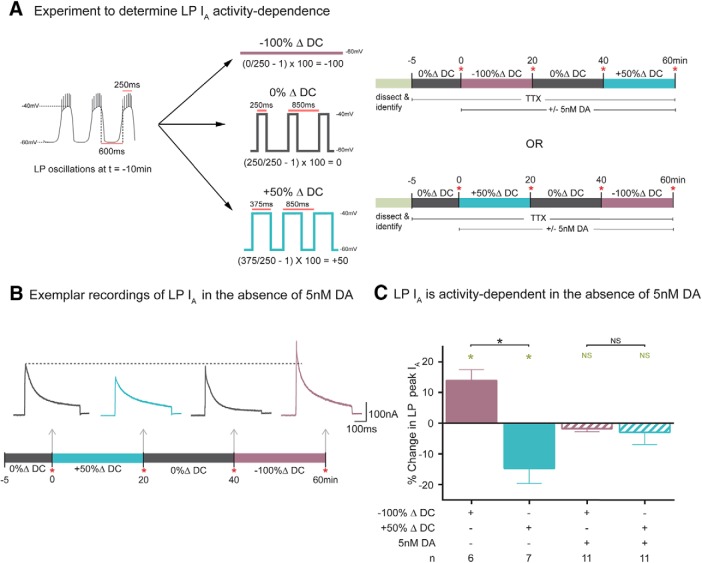
Duty cycle continuously regulates LP IA density, and tonic 5 nm DA gates this regulation. A, Experimental protocol for examining the activity dependence of LP IA. Left, Diagram represents LP slow-wave activity at t = −10 min. Plateau duration (250 ms), peak (−40 mV), and nadir (−60 mV) voltages, and cycle period (850 ms) were measured and used to create three voltage protocols: −100%, 0%, and 50% ΔDC. Voltage protocols were always specifically designed for each cell based on measurements from that cell. The protocols were used in the experiments diagramed on the right. At t = −5 min, TTX was bath-applied and the 0% ΔDC protocol was initiated. At t0, the current was measured (red asterisk) and one of the two series of voltage protocols shown was implemented in the presence or absence of 5 nm DA. Each voltage protocol lasted 20 min, and the current was measured at the end of each protocol as indicated by red asterisks. The order of the voltage protocols was varied between experiments as shown in the two timelines. B, LP IA traces from a single exemplar experiment show that LP IA is continuously regulated by duty cycle. Difference current traces are shown for the indicated time points. Calibration: 100 nA, 100 ms. The 20 min alterations in duty cycle produced bidirectional alterations in peak IA. C, Increasing LP duty cycle reduces IA, decreasing LP duty cycle enhances IA, and 5 nm DA blocks LP IA activity dependence. The experiment diagrammed in Figure 3A was performed in the presence or absence of 5 nm DA. Plot represents the mean percent change in peak IA produced by a given change in duty cycle [(t60/t40 or t20/t0) − 1 × 100]. Green asterisks indicate significant difference within a treatment group using paired t tests (t0 vs t20, or t40 vs t60; p ≤ 0.05). Black asterisks indicate significant differences using a one-way ANOVA with Bonferroni's multiple comparisons post hoc tests to compare selected pairs, as indicated (F(3,31) = 8.512; p = 0.0003).

