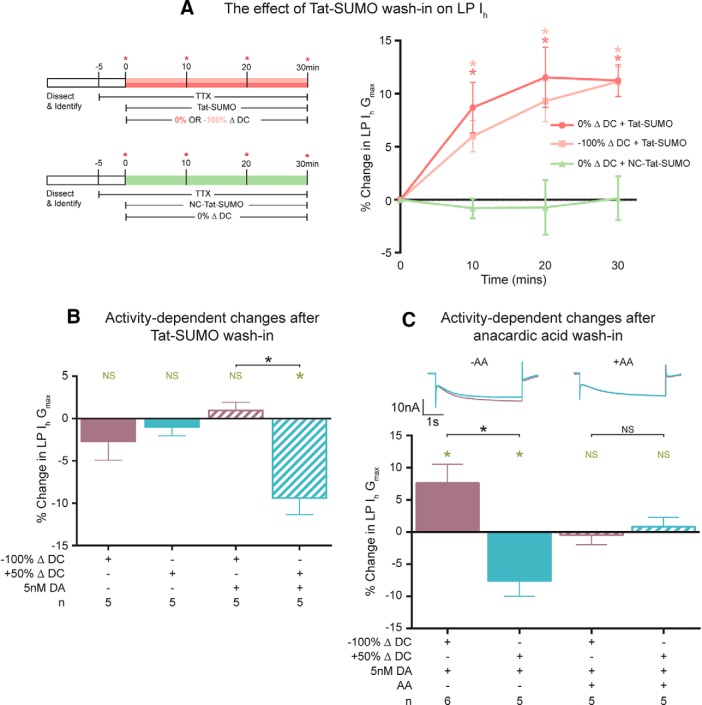
Figure 8.
Dynamic SUMOylation is necessary for DA-enabled LP Ih activity dependence. A, Enhancing SUMO conjugation mimics the increase in Ih associated with a decrease in duty cycle in the presence of 5 nm DA. LP Ih was measured before and during an (NC)-Tat-SUMO wash-in while a voltage protocol was implemented. Left, Diagrams represent the experiments. Red asterisks indicate points where LP Ih was measured. Right, Plot represents the percent change in LP Ih Gmax at t10, t20, and t30 relative to t0. Asterisks indicate significantly different using repeated-measures ANOVAs with Dunnett's post hoc tests that compared each data point with t0. 0% ΔDC + Tat-SUMO: F(4,12) = 21.03; p = 0.0026, n = 5; −100% ΔDC + Tat-SUMO: F(5,15) = 23.01; p = 0.0002, n = 6; 0% ΔDC + NC Tat-SUMO: F(3,9) = 0.5305; p = 0.5792, n = 4. B, Enhancing SUMO conjugation occludes the DA-enabled, activity-dependent increase in LP Ih Gmax but does not alter the DA-enabled activity-dependent decrease. After a 30 min activated Tat-SUMO wash-in, LP Ih was measured; DA was or was not added to the superfusate containing activated Tat-SUMO; and the standard series of voltage protocols was applied and LP Ih was measured at the end of each protocol as diagrammed in Figure 3A. The percent change in LP Ih Gmax elicited by the 50% ΔDC or −100% ΔDC protocol relative to the preceding 0% ΔDC protocol was plotted. Green asterisk indicates significant difference using a paired t test (p = 0.0074). Black asterisk indicates significant difference using a one-way ANOVA with Bonferroni's multiple comparisons post hoc tests to compare selected pairs, as indicated (F(3,16) = 7.101; p = 0.003). C, SUMO deconjugation mimics and occludes the decrease in LP Ih elicited by an increase in duty cycle, and blocking SUMO conjugation abolishes the increase in LP Ih elicited by a decrease in duty cycle. Anacardic acid (AA) was or was not washed in for 1 h and LP Ih was measured. DA was added to the superfusate, the standard series of voltage protocols was applied, and Ih was measured at the end of each protocol as diagrammed in Figure 3A. Top, Overlay of two current traces elicited by a hyperpolarizing test pulse to −120 mV from a representative experiment. Calibration: 10 nA, 1 s. Bottom, Plot of the percent change in LP Ih Gmax elicited by the 50% ΔDC or 100% ΔDC protocol relative to the preceding 0% ΔDC protocol. Green asterisks indicate significant differences within a treatment group (p < 0.05) using a paired t test (−100% ΔDC vs 0% ΔDC; 50% ΔDC vs 0% ΔDC). Black asterisk indicates significant difference between the four treatment groups using a one-way ANOVA with Bonferroni's multiple-comparisons post hoc tests to compare selected pairs, as indicated (F(3,17) = 7.814; p = 0.0017).

