Figure 4.
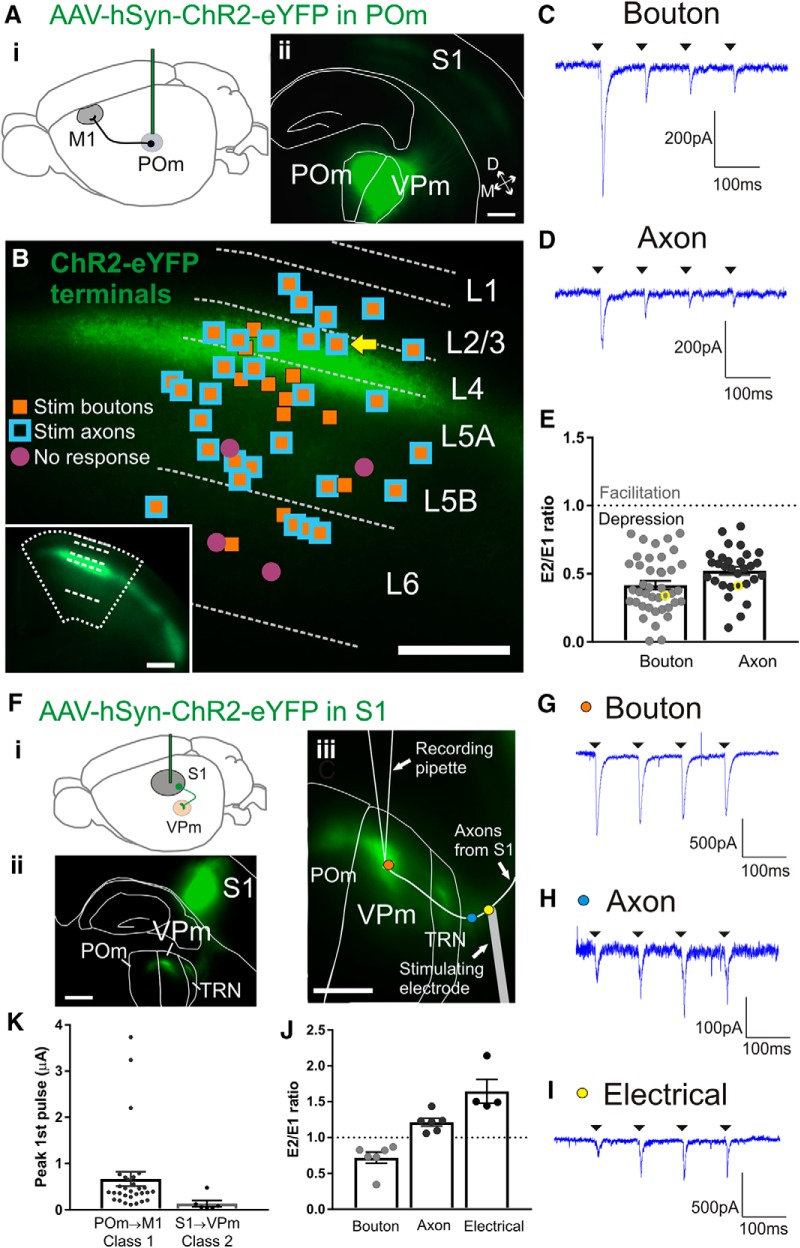
Class 1 synaptic responses of M1 cells in response to activation of POm inputs. Ai, Schematic of the ChR2-eYFP injection in POm to test the synaptic properties of the POm to M1 projection. Aii, Epifluorescence image of a representative coronal slice containing the POm injection site. We aimed our injections closer to border of adjacent VPm (resulting in characteristic expression in S1 barrels) to avoid infecting medial thalamic nuclei which also project to M1. B, Relative positions of all patched M1 cells overlaid on a representative epifluorescence image of M1 with ChR2-eYFP terminal expression. Layers in M1 were defined by relative cortical depth and POm terminals showed characteristic projections to upper layers. Orange-filled squares are cells that responded with paired-pulse depression to optogenetic stimulation of boutons. Blue squared outlines are cells responded with paired-pulse depression to optogenetic axon stimulation >0.32 mm from recorded cell body. All cells that received axon stimulation also received bouton stimulation. Purple-filled circles are cells with no response to optogenetic stimulation. Bottom left inset, Image of the same M1 coronal slice at a lower magnification. C, Example trace for the response of a layer 4 M1 cell (yellow arrow in B) during four pulses of bouton laser stimulation. D, Trace from the same M1 cell during axon laser stimulation. E, Paired-pulse ratios of all M1 cells. The ratios from the traces in C and D are indicated by yellow circles. The response to optogenetic bouton stimulation was smaller compared with axon stimulation (p = 0.012, Wilcoxon test). A ratio of <1 represents paired-pulse depression and a ratio >1 represents facilitation. Fi, Schematic of the strategy to express ChR2-eYFP in the S1 layer 6 projection to VPm. Fii, Epifluorescence image of an example somatosensory slice showing the S1 injection site and the eYFP-labeled terminals in TRN, VPm, and POm. S1 projections to TRN and VPm arise only from layer 6. The imaged slice was 410 μm thick and viewed under the L5 filter after cell recordings were completed. Fiii, View of the same example slice depicting the relative locations of the three stimulation sites during recording of a VPm cell: optogenetic stimulation of terminal boutons (orange dot), optogenetic stimulation of axons (blue dot), and electrical stimulation at the internal capsule (yellow dot). G, Response of the VPm cell shown in Fiii to four pulses at the bouton (orange dot in Fiii). H, Response of the same cell showing paired-pulse facilitation to optogenetic axon stimulation (blue dot in Fiii). I, Response of the same cell showing paired-pulse facilitation to electrical stimulation at the internal capsule (150 μA; yellow dot in Fiii). J, Paired-pulse ratios of VPm cells responding to bouton, axon, and electrical stimulation. Optogenetic bouton stimulation elicited a strong depression compared with electrical stimulation of the axon for the same cell (p = 0.014, Dunn's test). K, Maximum amplitudes of the first pulse during optogenetic axon stimulation for the two synapses tested. The EPSPs from the POm to M1 synapse were larger than the S1 to VPm class 2 synapse (p = 0.0019, Mann–Whitney test). All scale bars are 200 μm. Error bars indicate SEM.

