Figure 5.
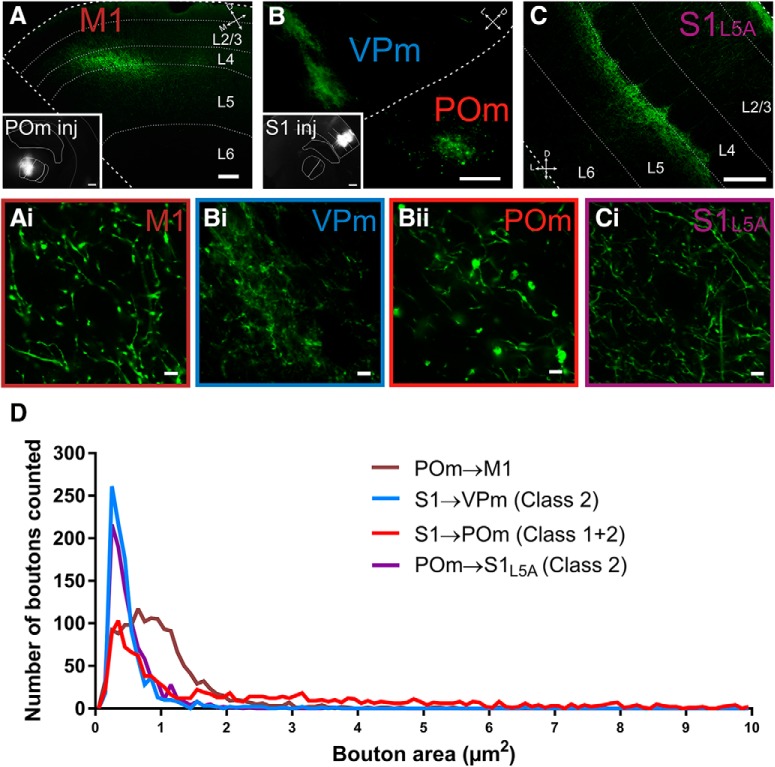
Terminal sizes in the POm to M1 projection indicate a class 1 synapse. A–C, Epifluorescence images of AAV-hSyn-ChR2-eYFP terminations in the POm to M1 projection (A) the S1 to VPm (class 2) and POm projections (class 1 and 2) (B) and the POm to S1 projection (class 2) (C). Insets show the corresponding injection sites. Note the higher level of expression of AAV in layer 5 compared with layer 6 of S1 (B, inset). The S1 photo shown in C shared the same injection as in A. Ai–Ci, Representative photomicrographs at high magnification of boutons from the corresponding photos in A–C. D, Histograms of bouton area per projection illustrating that class 1 synapses have a longer distribution in the upper range of bouton sizes, whereas class 2 synapses show a distribution restricted to smaller bouton sizes. Scale bars: A–C, 100 μm; A and B insets, 400 μm; Ai, Bi, Bii, and Ci, 5 μm.

