Figure 5.
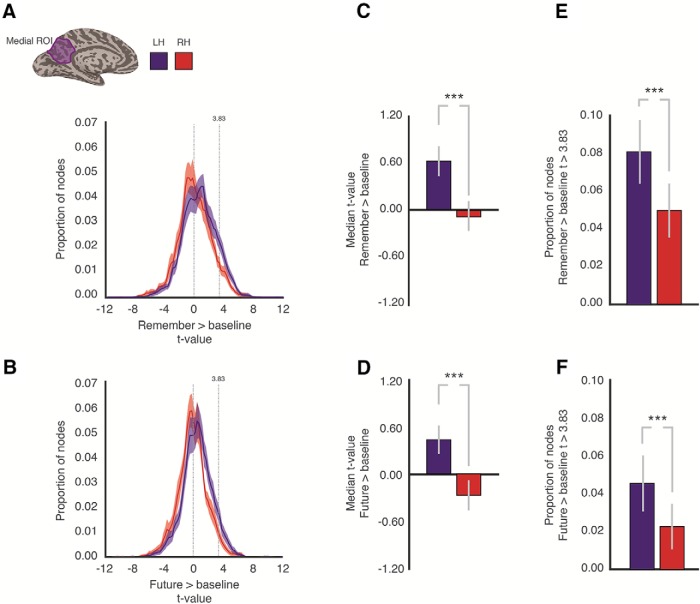
Hemispheric asymmetries in mnemonic representations. A, In each participant and hemisphere, an anatomical ROI for medial parietal cortex was defined. The posterior boundary of this ROI tracked the posterior bank of the POS to the dorsal bank of the calcarine sulcus and extended anteriorly to the splenium of the corpus callosum, including the precuneus. An example is shown for the left hemisphere of a single participant (purple ROI). From this ROI, we calculated the distribution of t values for the contrast of Remember > Baseline in both the left (blue line) and right (red line) hemispheres. Vertical dashed line at t = 0 indicates the boundary between baseline (negative values) and Remember responses (positive values). Dashed line at t = 3.83 indicates the threshold applied to these data for establishing significant responses. There is a clear rightward shift in the distribution for the left hemisphere, relative to the right. B, Same as in A, but for Future > Baseline. Solid line indicates the mean. Shaded area represents the SEM across participants. C, Error bars indicate the mean of the median t value from the anatomical ROI in both hemispheres. The left hemisphere contained on average significantly higher positive t values. D, Same as in C, but for Future > Baseline. E, Bars represent the proportion of suprathreshold nodes from the anatomical ROI. The left hemisphere contained a significantly higher proportion of suprathreshold nodes. F, Same as in E, but for Future > Baseline. ***p < .001.

