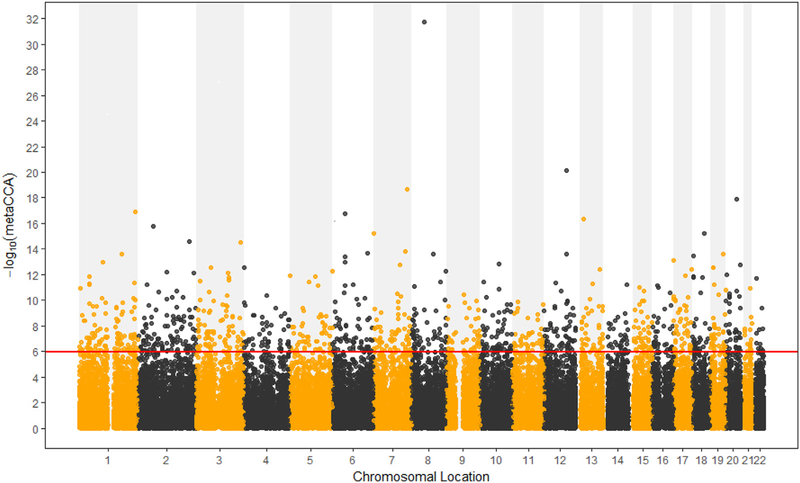
Fig. 1.
Manhattan plot of −log10 (metaCCA) values for univariate SNP-five disorders analysis. The red line marks the −log10 (metaCCA) value of 5.98 corresponds to p < 1.06 × 10⁻⁶. If the −log10 (metaCCA) value of a certain SNP was greater than 5.98, this SNP was identified as a pleiotropic SNP for the five correlated disorders.

