Figure 1:
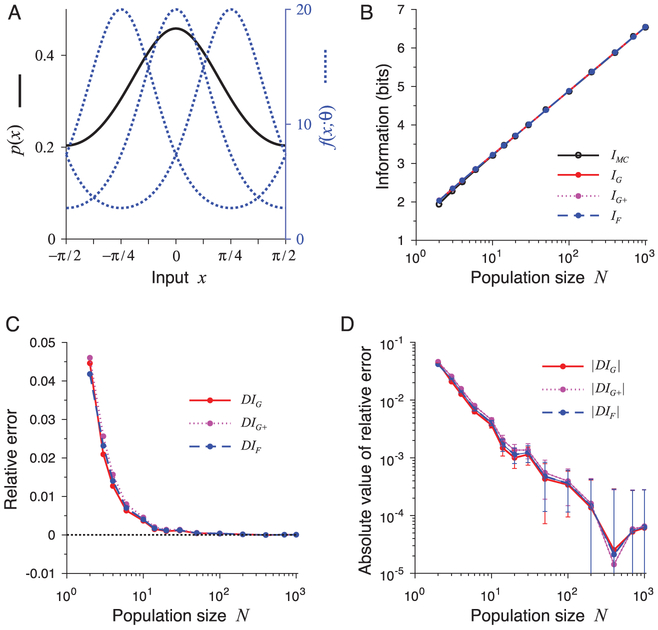
A comparison of approximations IMC, IG, IG+, and IF for one-dimensional input stimuli. All of them were almost equally good, even for small population size N. (A) The stimulus distribution p(x) and tuning curves f (x; θ) with different centers θ = −π/4, 0, π/4. (B) The values of IMC, IG, IG+, and IF all increase with neuron number N. (C) The relative errors DIG, DIG+, and DIF for the results in panel B. (D) The absolute values of the relative errors ∣DIG∣, ∣DIG+∣, and ∣DIF∣, with error bars showing standard deviations of repeated trials.

