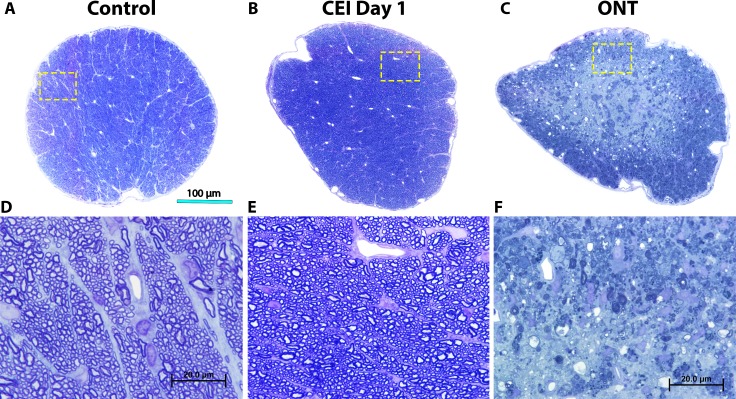
Figure 1.
Optic nerve axonal appearance after CEI or ONT. Transverse sections of retrobulbar optic nerves stained with toluidine blue. Representative low magnification images of a control optic nerve (A), as well as optic nerves 1 day post CEI (B), or 2 weeks post ONT (C). High-magnification images of optic nerves (D–F) corresponding to insets (yellow box) from the low-magnification images (A–C). Note the highly organized and intact axons and axon bundles in control (A, D) and CEI day 1 (B, E) nerves, in contrast to significant axon degeneration noted after ONT (C, F).

