Figure 3.
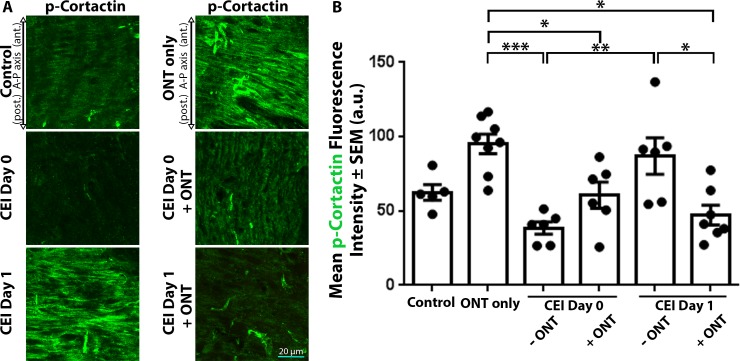
ONH cortactin phosphorylation label intensities respond differentially after IOP elevation, in the presence or absence of viable axons. (A) ONH sections labeled with antiphosphorylated cortactin (p-cortactin) antibodies in control eyes and eyes exposed to CEI, ONT, or a combination of CEI + ONT. ONH p-cortactin label intensity significantly increased 1 day post CEI (A, B, CEI day 1 versus CEI day 0). However, when CEI and ONT were combined, ONH p-cortactin label intensity significantly decreased after CEI (A, B). (B) Mean p-cortactin label intensities within the ONH of control eyes and eyes exposed to ONT only, CEI only, or combined CEI + ONT. Error bars indicate SEM; *P < 0.05, **P < 0.005, and ***P < 0.0001 and indicates statistical significance; n = 5, 8, 6, 6, 6, and 7 for each column from left to right, and represents individual animals.

