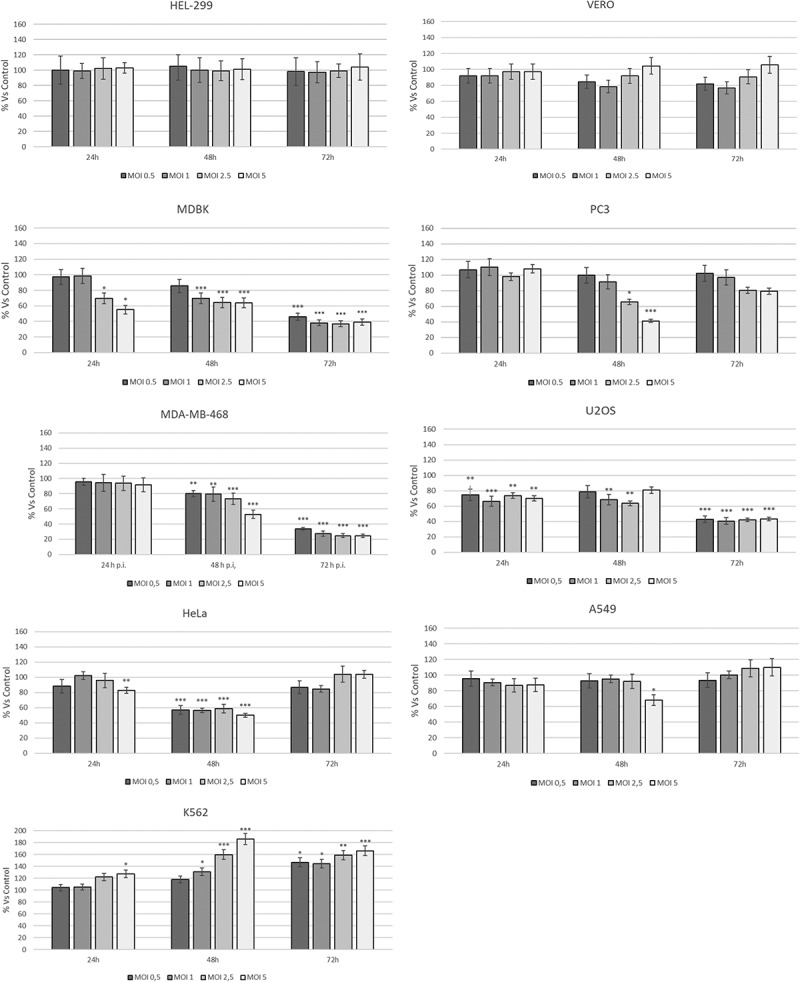
Figure 2.

Dose–response curve of human cancer cell lines infected with different MOI of CpHV-1 at different times p.i.. MTT test was performed at different hours post infection and the absorbance assayed as described in the Materials and Methods Section. Data are presented as a percentage of the cell viability calculated respect to control and results are expressed as the mean ± SD of three independent experiments performed in duplicate. Statistical differences between control and CpHV-1 infected groups were evaluated by one-way analysis of Variance (ANOVA), followed by Turkey’s post-test and indicated by probability P. *P < 0.05, **P < 0.01, and ***P < 0.001. The SD was calculated on the raw data and expressed as a percentage.
