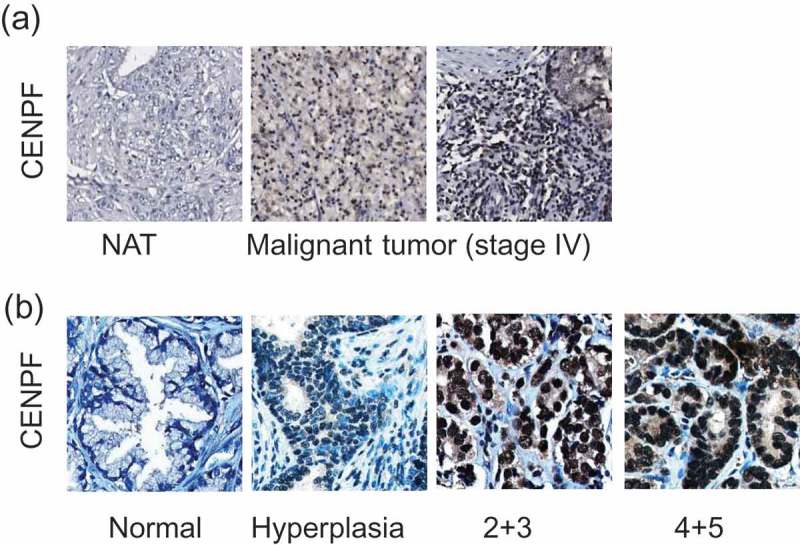
Figure 1.

CENPF expression is correlated with PC progression. Two independent tissue microarrays (TMAs) were used. TMA slides were stained with CENPF specific antibody (brown) and counterstained with hematoxylin (blue). (a) The IHC images represent adjacent normal prostate tissues (NAT) or tumors from PC patients with different stages, as described in figures. (b) Representative IHC images show the differential CENPF protein levels.
