Figure 5.

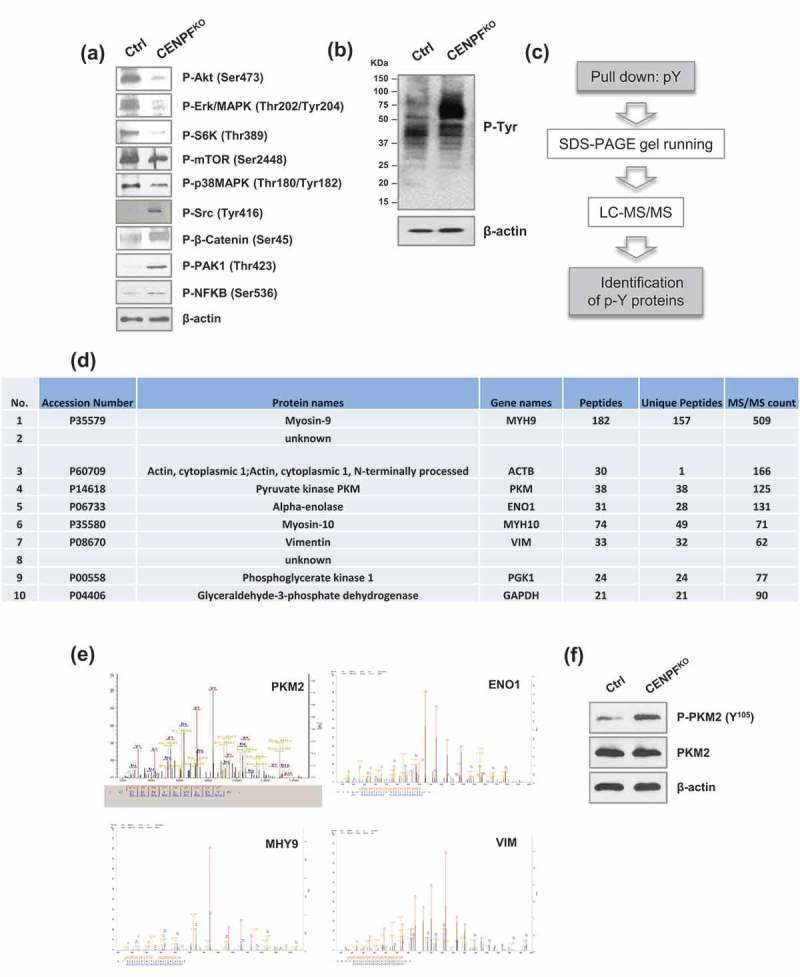
CENPF reduce metabolism in prostate cancer cells. (a) Western blot analysis of key signal transduction proteins. (b) Western blot analysis of phospho-tyrosine (pY) signaling was performed in CENPFKO cells and Ctrl. (c) A workflow including phospho-tyrosine-enrichment by protein pull-down and LC–MS/MS illustrates the experimental design to identify the tyrosine phosphorylated proteins specifically enriched in CENPFKO cells. (d) The 10 top proteins identified from B. (e) Representative MS spectrum of PKM2, ENO1, MHY9, and VIM, which were identified in this study. (f) Phosphorylation of PKM2 at Y105 and non-phosphorylated form of PKM2 were assessed by western blot analysis in CENPFKO cells and Ctrl. β-actin was used as the loading control.
