Figure 6.

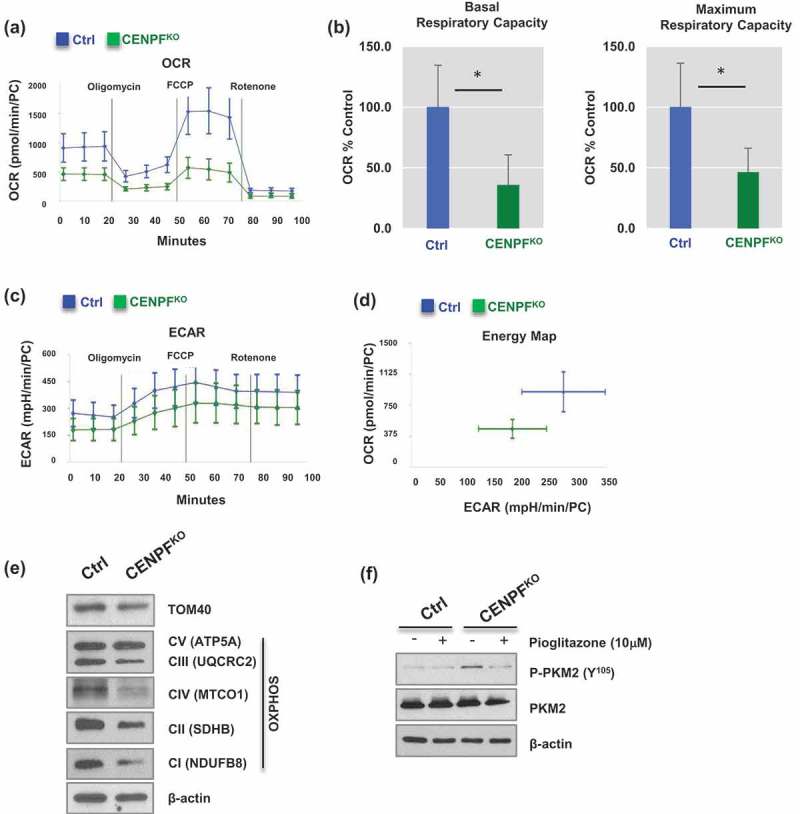
Silencing of CENPF decreased mitochondrial oxidative phosphorylation. The mitochondrial biogenetic activity was determined for CENPFKO and Ctrl in real-time using the Seahorse extracellular flux analyzer. (a) The oxygen consumption rate (OCR) curves in CENPFKO cells and Ctrl treated with oligomycin, FCCP and rotenone/antimycin A (n = 6 independent experiments). The OCR curves were determined by using a Seahorse XF24 Analyzer. (b) Basal and maximum respiratory capacity normalized to the cell numbers in CENPFKO cells and Ctrl. (c) Extracellular acidification rate (ECAR) was determined. (d) An energy map showing difference between CENPFKO cells and Ctrl. (e) Western blot analysis was performed to measure the levels of TAM20 and OXPHOS proteins. (f) Western blot data showing phospho-PKM2 (Y105) and PKM2 expression in CENPFKO cells and Ctrl in presence or absence of pioglitazone. Both cells were treated with 10μM pioglitazone for 24 h before sample preparation. The graphs shown here are representative examples of three independent experiments. The data represent the mean ± standard deviation. A two-tailed Student’s t-test was used to calculate statistical significance.
