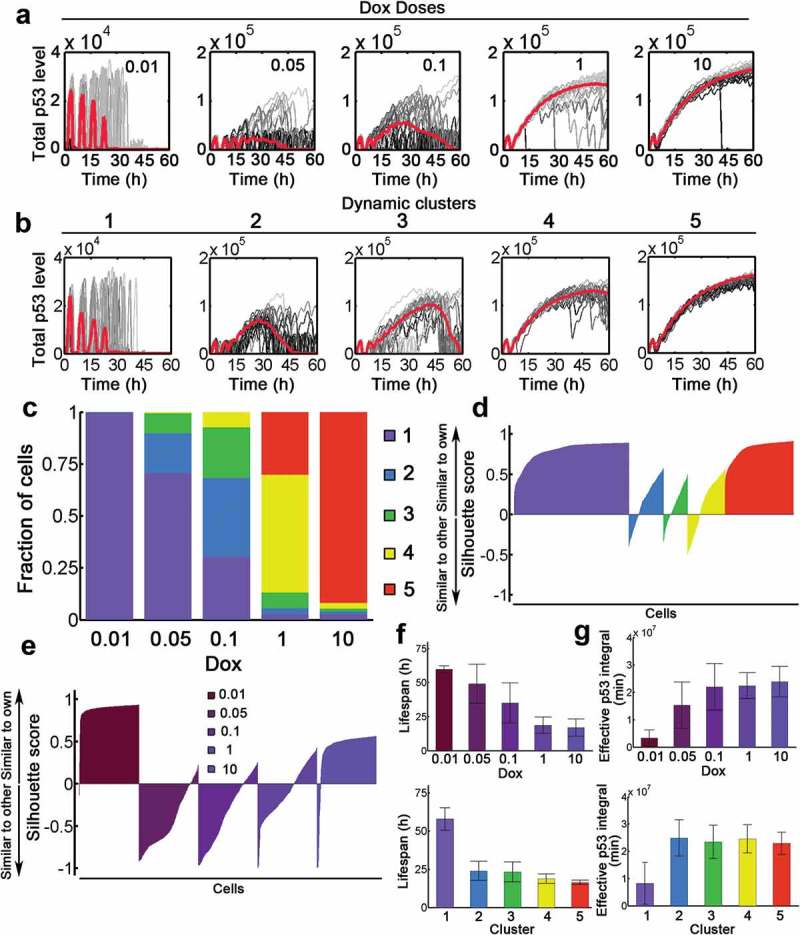
Figure 5.

P53 dynamics decompose into distinct signaling classes. (a) Time-resolved analysis of p53 dynamics for varying stimulus levels as indicated (Dox = 0.01–10). 20 representative cases were shown as well as the population median (red). (b) P53 dynamics were clustered into 5 signaling classes according to their time-resolved data. The population median values were shown (red). (c) Distributions of signaling classes depending on Dox levels. (D-E) Silhouette plots of cells sorted according to signaling classes (d) and Dox levels (e). Positive silhouette scores indicate that P53 dynamics are more similar to the own group, whereas negative scores indicate that the trajectory is closer to any of the other groups. (f) The lifespan distribution of cells treated with different Dox levels (top) or dynamic clusters (top). Note that if cell survived during the whole simulation period (60 h), the lifespan was recorded as 60 h. (g) Effective p53 integral for cells with varying Dox (top) and different clusters (bottom).
