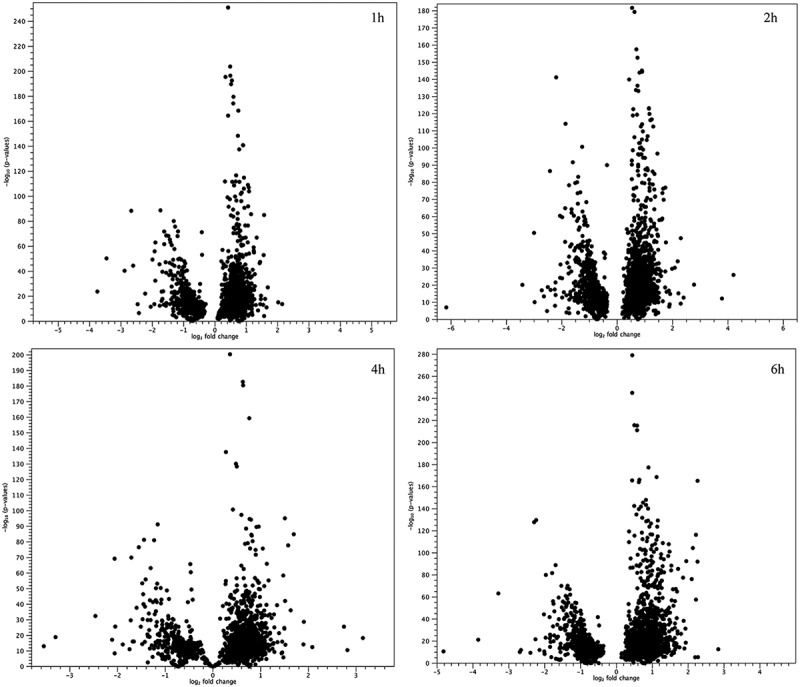
Figure 3.

Volcano plots for all genes involved in 14 “macro-pathways”. Represented volcano plots are based on p-values and fold-changes, produced by the EDGE test, for all genes involved in 14 “macro-pathways”. It is highlighted how the most of analyzed genes differ between treated and untreated samples.
