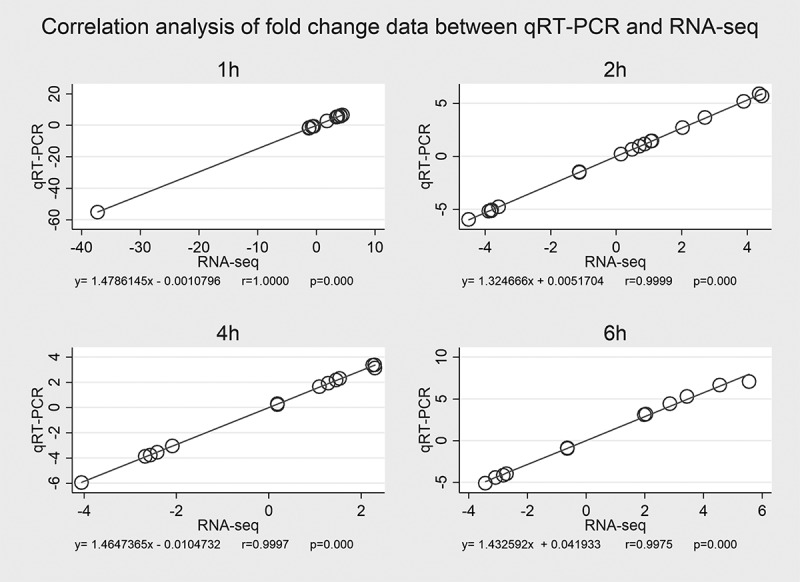
Figure 5.

Correlation analysis of fold – change data between qRT – PCR and RNA – Seq. Expression data of 20 selected genes from qRT – PCR and RNA – Seq are means of three replicates, considering all selected time points (a, b, c, d). Scatterplots were generated by the fold – change values from RNA – Seq (x – axis) and qRT – PCR (y – axis).
