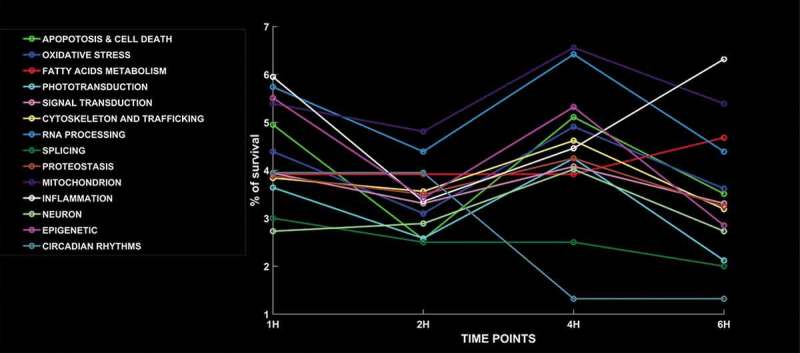
Figure 6.

Time – dependent trend of selected 14 pathways. The 14 candidate “macro-pathways” showed a time of exposure-related trend very variable for each one. The most of them exhibit a decrease of % of survival at 2 h and an increase at 4 h. Exceptions are represented by “Circadian rhythms” (stable until 2 h, then decreases until 4 h and it doesn’t change furthermore), “Fatty acids metabolism” (stable until 4 h and then increases after 6 h), “Phototransduction” (decreasing to 1 h, then increasing until 4 h and, finally, decreasing until 6 h) and “Inflammation” (decreases until 2 h, then increases).
