Figure 5.

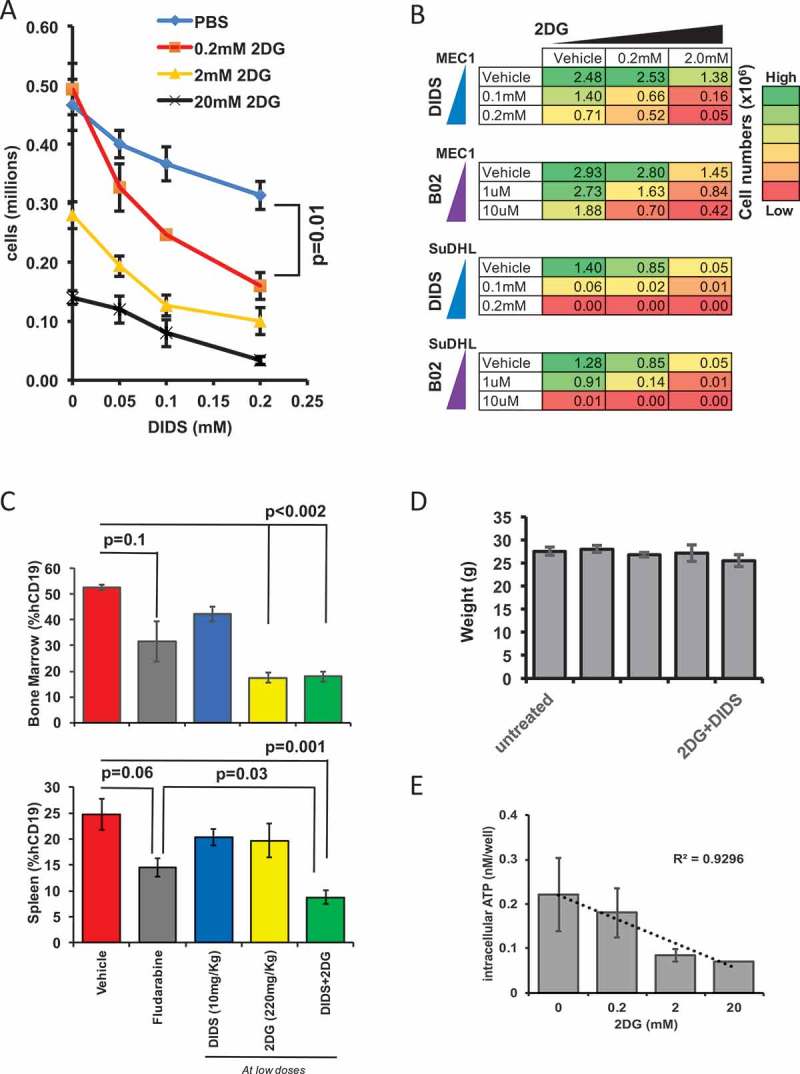
Glycolysis blockade and RAD51 inhibition exhibits a synergistic and enhanced anti-cancer effect on tumor burden. (A) Ex vivo intracellular ATP levels in MEC1 cells incubated with different doses of DIDS and 2DG 48 hours after incubation. (B) Heat map of the proliferation of MEC1 and SuDHL cells treated with 2DG or DIDS ex vivo. The color shows the numbers (in millions) of cells after 5 days of proliferation. Initial number for MEC1 was 1 million cells and SuDHL was 0.5 million cells. (C) In vivo MEC1 tumor burden as measured by the percentage of hCD19+ cells in the spleen and bone marrow after two-week treatment with low doses of DIDS and/or 2DG, with fludarabine, or with glucose (N = 4–13 mice in two experiments). (D) Average weight of the mice in each group at the end of the treatment regimen. (E) Ex vivo intracellular ATP of MEC1 cells incubated in 2DG at varying concentrations for 24 hours (N = 3).
